MACD Bull Crossover and RSI Oversold 5 Candles Ago-Long StrategyHello everyone, I've been having a great time perfecting this strategy for a few weeks now. I finally feel like it's time to release it to the public and share what I have been working on.
This strategy only enters a long trade when the MACD crosses over the signal line and the RSI was oversold looking back 5 candles ago. The logic behind this is to wait for RSI to enter the oversold territory, and then when the market starts to recovery the MACD will crossover telling us the sell off is over.
This strategy will close once these 2 conditions are met.
1. MACD Histogram is above 0 and MACD crosses under the signal line.
2. RSI was overbought 5 previous candles ago.
In the strategies settings, you'll be able to enable visual stop-loss and profit levels and change those levels to what you like, enable up to 5 EMA'S,
ADDONS That Affect Strategy:
* Enable visual stop-loss and profit levels as soon as a buy signal is triggered.
* Modify stop-loss and profit levels.
* Modify RSI oversold and RSI overbought levels.
* Modify MACD Fast and Slow moving average.
ADDONS That Do Not Affect Strategy:
* Enable up to 5 EMA's. (This will not affect strategy, and is the only purpose is for people who like following EMA's.)
Thank you for taking the time to try my strategy. I hope you have the best success. I will be making a short strategy, and alerts for this strategy soon. Follow me for updates!
Pesquisar nos scripts por "the strat"

MARUSIA TRADING STRATEGIES [VCRYPTO]Description of MARUSIA TRADING STRATEGIES
«MARUSIA» is a compilation of several strategies.
You may choose the one which best suits your trading habit from options menu.
The strategies are based on indicator’s and bar’s closing level analysis on different timeframes.
At the time being there are 3 types of strategies for BTC on 1H and 3H tf.
+++ BTC 1H 90% Success +++ (Beginner)
Instrument - BTC, timeframe – 1H, exchange – Bitmex.
The advantage of the strategy is a high quantity of profitable trades (90% at the time of publishing).
The Trading View backtest results from 2019:
+ 303% net profit
+ 90% profitable trades
+ 6% drawback
+++ BTC 1H Mega Scalper +++ (Intermediate)
Instrument - BTC, timeframe – 1H, exchange – Bitmex.
The advantage of the strategy is more frequent trades with a good probability of success.
The Trading View backtest results from 2019:
+ 792% net profit
+ 64% profitable trades
+ 5% drawback
+++ BTC 3H Mega Scalper +++ (Expert)
Instrument - BTC, timeframe – 3H, exchange – Bitmex.
The advantage of the strategy is more frequent trades with a good probability of success.
The Trading View backtest results from 2018:
+ 1637% net profit
+ 79% profitable trades
+ 4,4% drawback
HOW TO USE
1. Choose the strategy from the strategy’s option menu on the chart. Pay attention to the instrument and timeframe you are using the selected strategy for.
2. Wait until you see green (above bar) or orange (below bar) label. To receive an alert when these labels (or signals) appear on the chart use ALERT INDICATOR for this strategy.
3. On the opening of the next bar enter the position if the label on the previous bar hasn’t disappeared. Green – for Buy, orange – for Sell. In this case you will see Buy/Sell signal on the chart.
4. Putting TRAILING STOPS
4.1. You should put a trailing stop when the price moves to profit up or down for 1% from your entry. For example, if you are long at 7255 USD and price moves up to 7328 USD (7255*1.01), put trailing stop with a trailing value 0,4% of your entry price, which is 29 USD (7255*0.004).
4.2. Every time when there is a long or short position, you may see a green info label with entry price, trail stop activation level and trail value. You may use this information instead of making a calculation by yourself. Only if your entry is the same as in the label.
5. Position closing maybe by reaching your trailing stop (in this case you may reenter the position on the next bar, if there is a signal label as per step 2 on the bar where your trailing stop is triggered) or when there is a signal for opposite direction.
6. If the signals appear differently than described as above, just refresh the website of Trading View. This happens because mostly take profits are shown only after the current bar is closed.
• The Buy/Sell signal label may move up or down on the bar with price’s movement. Don’t worry it doesn’t mean that your entry is changing.
• The lines on the chart are weekly price levels – the price levels of the previous week –
Green – open, Red – close, Blue – high, Brown – low, Black – hl2 (average of high and low). You may use them as support and resistance levels.
***
+ Trading View backtest results
+No repaint
+ Several strategies to choose which suits your trading habit
+Free testing
+Support with a call
Pm to get access to the strategy.
____________________________________________________________________________
Описание к стратегии "MARUSIA TRADING STRATEGIES "
Сборник нескольких стратегий серии "Marusia"
Выбор конкретной стратегии осуществляется из удобного меню
Основа наших стратегий - совмещение индикаторного анализа и анализа уровня закрытия свечей на разных временных интервалах (анализ уровней).
+++ BTC 1H 90% Success +++ (Beginner)
Стратегия работает на инструменте Bitcoin (BTC) по котировкам биржи BITMEX на 1 часовом таймфрейме (1H).
Основное преимущество данной стратегии - супервысокая успешность сделок (более 90% на момент публикации).
Данная стратегия представляет собой гибрид среднесрочных стратегий по частоте сделок (с 2019 по 12.04.2020 - 204 сделки, в среднем одна сделка раз в 2 дня) и элемент высокочастотных (скальп) стратегий - необходимо выставление использование скользящего стоп-приказа (trailing stop-loss), расчетные данные по которому появляются прямо на экране при открытии сделки.
Статистика по данной стратегии, подтвержденная бэктестом в Trading View
С 2019 года до момента публикации стратегии бектест показывает следующие данные:
+ 303% чистой прибыли
+ 90% успешных сделок
+ 6% макс. единовременная просадка
+++ BTC 1H Mega Scalper +++ (Intermediate)
Стратегия работает на инструменте Bitcoin (BTC) по котировкам биржи BITMEX на 1 часовом таймфрейме (1H)
Основное преимущество данной стратегии - высокочастотные сделки с хорошей вероятностью успеха.
С 2019 года до момента публикации стратегии бектест Trading View показывает следующие данные:
+ 792% чистой прибыли
+ 64% успешных сделок
+ 5% макс. единовременная просадка
+++ BTC 3H Mega Scalper +++ (Expert)
Стратегия работает на инструменте Bitcoin (BTC) по котировкам биржи BITMEX на 3 часовом таймфрейме (3H)
Основное преимущество данной стратегии - высокочастотные сделки с хорошей вероятностью успеха
С 2019 года до момента публикации стратегии бектест Trading View показывает следующие данные:
+ 1637% чистой прибыли
+ 79% успешных сделок
+ 4,4% макс. единовременная просадка
***
Инструкиция по использованию:
1. Вы открываете график с включенной стратегией. Обратите внимание на инструмент и таймфрейм стратегии.
2. Ожидаете появления на графике зеленого (снизу) или оранжевого (сверху) флажка.
Для получения уведомления появления значков (сигналов) используйте АЛЕРТНЫЙ ИНДИКАТОР для данной стратегии.
3. На открытии следующей свечи входите в сделку, если флажек из п.2 остался и не пропал (зеленый флажек - покупка, оранжевый - продажа)
4. Выставление trailing stop-loss
4.1 Trailing stop-loss выставляется, когда цена прошла 1% в профит от цены выхода в сделку (например: покупка 7255 и когда цена будет 7328 (7255*1,01) выставляется плавающий стоп-лосс (trailing stop-loss) в размере 0,4% от цены входа "29" (7255*0,004).
4.2. Как только будет закрыта свеча, на которой Вы вошли в сделку - вы увидете значения из п.4.1 на экране рядом с графиком (вы можете их использовать без самостоятельного расчета, но тогда есть риск, что если цена на свече входа достигнет значения из п. 4.1 - то сделка закроется, а вы это увидите только на следующей свече, когда значение цены может быть менее выгодное)
5. Выход из сделки осуществляется либо по trailing stop-loss (тогда вы можете перезайти в сделку на открытии следующей свечи, если на свече, на которой произошло закрытие по trailing stop-loss появились флажки из п.2), либо по появлению противоположного флажка, тогда вход в сделку, в соответствии с п. 2 и 3
7. Если Вы увидели, что сигналы отличаются от написанного в данной инструкции - просто обновите страницу с Trading View в браузере и все встанет на свои места.
* На свече захода в сделку сигнал "buy/sell" может "плавать" по свече, но если Вы выполнили п.1-3 Вам неочем беспокоиться. Не обращайте на него внимание.
***
Основные отличия от стратегий наших коллег:
+ Результаты бэктеста в платформе Trading View – прозрачная статистика по сделкам, которую вы можете посмотреть самостоятельно
+ Построен на принципах non-repaint basis – сигналы не исчезают (при правильном соблюдении инструкции по использованию)
+ Каждая стратегия серии построена на своем уникальном принципе - вы можете выбрать для себя оптимальный набор стратегий
+ Бесплатный тестовый период
+ Поддержка с возможностью организации телефонного звонка
Для предоставления доступа к данной стратегии - пожалуйста пишите в личные сообщения. Мы быстро с Вами свяжемся.
All Instrument Swing Trader with Pyramids, DCA and Leverage
Introduction
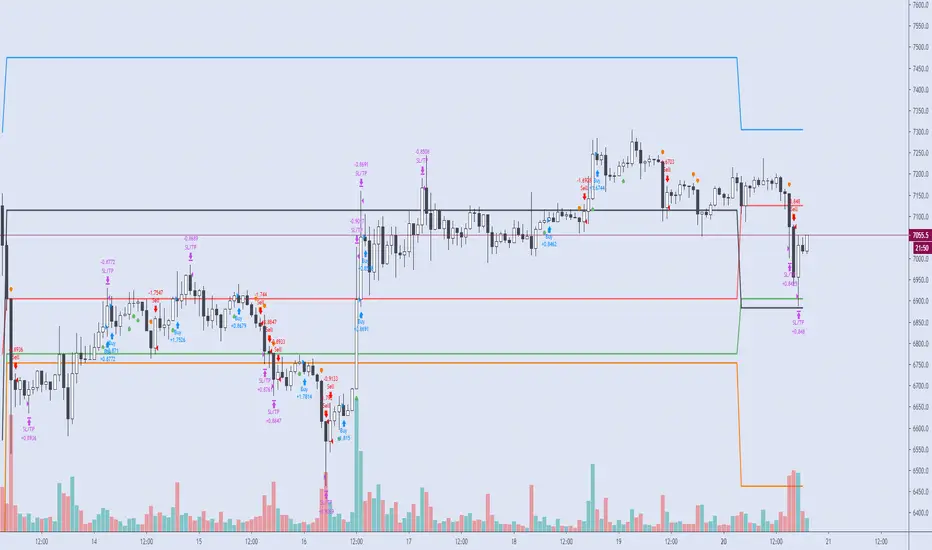
This is my most advanced Pine 4 script so far. It combines my range trader algorithms with my trend following pyramids all on a single interval. This script includes my beta tested DCA feature along with simulated leverage and buying power calculations. It has a twin study with several alerts. The features in this script allow you to experiment with different risk strategies and evaluate the approximate impact on your account capital. The script is flexible enough to run on instruments from different markets and at various bar intervals. This strategy can be run in three different modes: long, short and bidirectional. The bidirectional mode has two split modes (Ping Pong and BiDir). It also generates a summary report label with information not available in the TradingView Performance report such as Rate Of Return Standard Deviation and other Sharpe Ratio input values. Notable features include the following:
- Swing Trading Paradigm
- Uni or Bidirectional trading modes
- Calculation presets for Crypto, Stocks and Forex
- Conditional Minimum Profit
- Hard stop loss field
- Two types of DCA (Positive and Negative)
- Discretionary Pyramid levels with threshold adjustment and limiter
- Consecutive loss counter with preset and label
- Reentry loss limiter and trade entry caution fields
- Simulated Leverage and margin call warning label (approximation only)
- Buying power report labels (approximation only)
- Rate Of Return report with input values for Sharpe Ratio, Sortino and others
- Summary report label with real-time status indicators
- Trend follow bias modes (Its still range trading)
- Six anti-chop settings
- Single interval strategy to reduce repaint occurrence
This is a swing trading strategy so the behavior of this script is to buy on weakness and sell on strength. As such trade orders are placed in a counter direction to price pressure. What you will see on the chart is a short position on peaks and a long position on valleys. Just to be clear, the range as well as trends are merely illusions as the chart only receives prices. However, this script attempts to calculate pivot points from the price stream. Rising pivots are shorts and falling pivots are longs. I refer to pivots as a vertex in this script which adds structural components to the chart formation (point, sides and a base). When trading in “Ping Pong” mode long and short positions are intermingled continuously as long as there exists a detectable vertex. Unfortunately, this can work against your backtest profitability on long duration trends where prices continue in a single direction without pullback. I have designed various features in the script to compensate for this event. A well configured script should perform in a range bound market and minimize losses in a trend. For a range trader the trend is most certainly not your friend. I also have a trend following version of this script for those not interested in trading the range.
This script makes use of the TradingView pyramid feature accessible from the properties tab. Additional trades can be placed in the draw-down space increasing the position size and thereby increasing the profit or loss when the position finally closes. Each individual add on trade increases its order size as a multiple of its pyramid level. This makes it easy to comply with NFA FIFO Rule 2-43(b) if the trades are executed here in America. The inputs dialog box contains various settings to adjust where the add on trades show up, under what circumstances and how frequent if at all. Please be advised that pyramiding is an advanced feature and can wipe out your account capital if your not careful. You can use the “Performance Bond Leverage” feature to stress test your account capital with varying pyramid levels during the backtest. Use modest settings with realistic capital until you discover what you think you can handle. See the“Performance Bond Leverage” description for more information.
In addition to pyramiding this script employs DCA which enables users to experiment with loss recovery techniques. This is another advanced feature which can increase the order size on new trades in response to stopped out or winning streak trades. The script keeps track of debt incurred from losing trades. When the debt is recovered the order size returns to the base amount specified in the TV properties tab. The inputs for this feature include a limiter to prevent your account from depleting capital during runaway markets. The main difference between DCA and pyramids is that this implementation of DCA applies to new trades while pyramids affect open positions. DCA is a popular feature in crypto trading but can leave you with large “bags” if your not careful. In other markets, especially margin trading, you’ll need a well funded account and much experience.
To be sure pyramiding and dollar cost averaging is as close to gambling as you can get in respectable trading exchanges. However, if you are looking to compete in a Forex contest or want to add excitement to your trading life style those features could find a place in your strategies. Although your backtest may show spectacular gains don’t expect your live trading account to do the same. Every backtest has some measure to data mining bias. Please remember that.
This script is equipped with a consecutive loss counter. A limit field is provided in the report section of the input dialog box. This is a whole number value that, when specified, will generate a label on the chart when consecutive losses exceed the threshold. Every stop hit beyond this limit will be reported on a version 4 label above the bar where the stop is hit. Use the location of the labels along with the summary report tally to improve the adaptability of system. Don’t simply fit the chart. A good trading system should adapt to ever changing market conditions. On the study version the consecutive loss limit can be used to halt live trading on the broker side (managed manually).
This script can simulate leverage applied to your account capital. Basically, you want to know if the account capital you specified in the properties tab is sufficient to trade this script with the order size, pyramid and DCA parameters needed. TradingView does not halt trading when the account capital is depleted nor do you receive notification of such an event. Input the leverage you intend to trade with and simulate the stress on your account capital. When the check box labeled “Report Margin Call” is enabled a marker will plot on the chart at the location where the threshold was breached. Additionally, the Summary Report will indicated such a breach has occurred during the backtest. Please note that the margin calculation uses a performance bond contract model which is the same type of leverage applied to Forex accounts. This is not the same leverage as stock margin accounts since shares are not actually borrowed. It is also not applicable to futures contracts since we do not calculate maintenance margin. Also note that the account margin and buying power are calculated using the U.S. Dollar as a funding currency. Margin rules across the globe vary considerably so use this feature as an approximation. The “Report Margin Call” plot only appears on negative buying power which is well beyond the NFA enforced margin closeout price. Vary the order size and account capital and activate the buying power plot to get as close as you can to the desired margin call threshold. Also keep in mind that rollover fees, commissions, spreads, etc affect the margin call in actual live trading. This feature does not include any of those costs.
Inputs
The script input dialog box is divided into five sections. The last section, Section 5, contains all of the script reporting options. Notable reporting options are the inputs which provide support for calculating actual Sharpe Ratios and other risk / performance metrics. The TradingView performance report does not produce a scalable Sharpe Ratio which is unfortunate considering the limited data supplied to the backtest. Three report fields made available in this section are intended to enable users to measure the performance of this script using various industry standard risk metrics. In particular, The Sharpe Ratio, Sortino Ratio, Alpha Calculation, Beta Calculation, R-Squared and Monthly Standard Deviation. The following fields are dedicated to this effort:
– ROR Sample Period - Integer number which specifies the rate of return period. This number is a component of the Sharpe Ratio and determines the number of sample periods divisible in the chart data. The number specified here is the length of the period measured in bar intervals. Since the quantity of TradingView historical data is limited this number should reflect the scalar value applied to your Sharpe calculation. When the checkbox “Report Period ROR” is enabled red boxes plot on the dates corresponding to the ROR sample period. The red boxes display information useful in calculating various risk and performance models. Ongoing buying power is included in the period report which is especially useful in assessing the DCA stress on account capital. Important: When the “ROR Sample Period” is specified the script computes the ROR mean value and displays the result in the summary report label on the live end of the chart. Use this number to calculate the historical standard deviation of period returns.
– Return Mean Value - This is the ROR mean value which is displayed in the summary report field “ROR Mean”. Enter the value shown in the summary report here in order to calculate the standard deviation of returns. Once calculated the result is displayed in the summary report field “Standard Dev”. Please note that ROR and standard deviation are calculated on the quote currency of the chart and not the account currency. If you intend to calculate risk metrics based on other denominated returns use the period calculations in a spreadsheet. Important: Do not change the account denomination on the properties tab simply to force a dollar calculation. It will alter the backtest itself since the minimum profit, stop-loss and other variables are always measured in the quote currency of the chart.
– Report Period ROR - This checkbox is used to display the ROR period report which plots a red label above the bars corresponding to the ROR sample period. The sample period is defined by the value entered into the “ROR Sample Period” field. This checkbox only determines if the period labels plot on the chart. It does not enable or disable the ROR calculation itself. Please see input description“ROR Sample Period” for a detailed description of this feature.
Design
This script uses twelve indicators on a single time frame. The original trading algorithms are a port from a much larger program on another trading platform. I’ve converted some of the statistical functions to use standard indicators available on TradingView. The setups make heavy use of the Hull Moving Average in conjunction with EMAs that form the Bill Williams Alligator as described in his book “New Trading Dimensions” Chapter 3. Lag between the Hull and the EMAs form the basis of the entry and exit points. The vertices are calculated using one of five featured indicators. Each indicator is actually a composite of calculations which produce a distinct mean. This mathematical distinction enables the script to be useful on various instruments which belong to entirely different markets. In other words, at least one of these indicators should be able generate pivots on an arbitrarily selected instrument. Try each one to find the best fit.
The entire script is around 2200 lines of Pine code which pushes the limits of what can be created on this platform given the TradingView maximums for: local scopes, run-time duration and compile time. This script incorporates code from both my range trader and trend following published programs. Both have been in development for nearly two years and have been in beta test for the last several months. During the beta test of the range trading script it was discovered that by widening the stop and delaying the entry, add on trading opportunities appeared on the chart. I determined that by sacrificing a few minor features code space could be made available for pyramiding capability in the range trader. The module has been through several refactoring passes and makes extensive use of ternary statements. As such, It takes a full three minutes to compile after adding it to a chart. Please wait for the hovering dots to disappear before attempting to bring up the input dialog box. For the most part the same configuration settings for the range script can be applied to this script.
Inputs to the script use cone centric measurements in effort to avoid exposing adjustments to the various internal indicators. The goal was to keep the inputs relevant to the actual trade entry and exit locations as opposed to a series of MA input values and the like. As a result the strategy exposes over 70 inputs grouped into long or short sections. Inputs are available for the usual minimum profit and stop-loss as well as safeguards, trade frequency, pyramids, DCA, modes, presets, reports and lots of calibrations. The inputs are numerous, I know. Unfortunately, at this time, TradingView does not offer any other method to get data in the script. The usual initialization files such as cnf, cfg, ini, json and xml files are currently unsupported.
I have several example configuration settings that I use for my own trading. They include cryptocurrencies and forex instruments on various time frames.
Indicator Repainting and Anomalies
Indicator repainting is an industry wide problem which mainly occurs when you mix backtest data with real-time data. It doesn't matter which platform you use some form of this condition will manifest itself on your chart over time. The critical aspect being whether live trades on your broker’s account continue to match your TradingView study.
Based on my experience with Pine, most of the problems stem from TradingView’s implementation of multiple interval access. Whereas most platforms provide a separate bar series for each interval requested, the Pine language interleaves higher time frames with the primary chart interval. The problem is exacerbated by allowing a look-ahead parameter to the Security function. The goal of my repaint prevention is simply to ensure that my signal trading bias remains consistent between the strategy, study and broker. That being said this is what I’ve done address this issue in this script:
1. This script uses only 1 time frame. The chart interval.
2. Every entry and exit condition is evaluated on closed bars only.
3. No security functions are called to avoid a look-ahead possibility.
4. Every contributing factor specified in the TradingView wiki regarding this issue has been addressed.
5. Entry and exit setups are not reliant on crossover conditions.
6. I’ve run a 10 minute chart live for a week and compared it to the same chart periodically reloaded. The two charts were highly correlated with no instances of completely opposite real-time signals. I do have to say that there were differences in the location of some trades between the backtest and the study. But, I think mostly those differences are attributable to trading off closed bars in the study and the use of strategy functions in the backtest.
The study does indeed bring up the TV warning dialog. The only reason for this is because the script uses an EMA indicator which according to TradingView is due to “peculiarities of the algorithm”. I use the EMA for the Bill Williams Alligator so there is no way to remove it.
One issue that comes up when comparing the strategy with the study is that the strategy trades show on the chart one bar later than the study. This problem is due to the fact that “strategy.entry()” and “strategy_exit()” do not execute on the same bar called. The study, on the other hand, has no such limitation since there are no position routines.
Please be aware that the data source matters. Cryptocurrency has no central tick repository so each exchange supplies TradingView its feed. Even though it is the same symbol the quality of the data and subsequently the bars that are supplied to the chart varies with the exchange. This script will absolutely produce different results on different data feeds of the same symbol. Be sure to backtest this script on the same data you intend to receive alerts for. Any example settings I share with you will always have the exchange name used to generate the test results.
Usage
The following steps provide a very brief set of instructions that will get you started but will most certainly not produce the best backtest. A trading system that you are willing to risk your hard earned capital will require a well crafted configuration that involves time, expertise and clearly defined goals. As previously mentioned, I have several example configs that I use for my own trading that I can share with you. To get hands on experience in setting up your own symbol from scratch please follow the steps below.
The input dialog box contains over 70 inputs separated into five sections. Each section is identified as such with a makeshift separator input. There are three main areas that must to be configured: long side, short side and settings that apply to both. The rest of the inputs apply to pyramids, DCA, reporting and calibrations. The following steps address these three main areas only. You will need to get your backtest in the black before moving on to the more advanced features.
Step 1. Setup the Base currency and order size in the properties tab.
Step 2. Select the calculation presets in the Instrument Type field.
Step 3. Select “No Trade” in the Trading Mode field.
Step 4. Select the Histogram indicator from Section 2. You will be experimenting with different ones so it doesn’t matter which one you try first.
Step 5. Turn on Show Markers in Section 2.
Step 6. Go to the chart and checkout where the markers show up. Blue is up and red is down. Long trades show up along the red markers and short trades on the blue.
Step 7. Make adjustments to “Base To Vertex” and “Vertex To Base” net change and roc in Section 3. Use these fields to move the markers to where you want trades to be.
Step 8. Try a different indicator from Section 2 and repeat Step 7 until you find the best match for this instrument on this interval. This step is complete when the Vertex settings and indicator combination produce the most favorable results.
Step 9. Go to Section 3 and enable “Apply Red Base To Base Margin”.
Step 10. Go to Section 4 and enable “Apply Blue Base To Base Margin”.
Step 11. Go to Section 2 and adjust “Minimum Base To Base Blue” and “Minimum Base To Base Red”. Observe the chart and note where the markers move relative to each other. Markers further apart will produce less trades but will reduce cutoffs in “Ping Pong” mode.
Step 12. Return to Section 3 and 4 and turn off “Base To Base Margin” which was enabled in steps 9 and 10.
Step 13. Turn off Show Markers in Section 2.
Step 14. Put in your Minimum Profit and Stop Loss in the first section. This is in pips or currency basis points (chart right side scale). Percentage is not currently supported. This is a fixed value minimum profit and stop loss. Also note that the profit is taken as a conditional exit on a market order not a fixed limit. The actual profit taken will almost always be greater than the amount specified (due to the exit condition). The stop loss, on the other hand, is indeed a hard number which is executed by the TradingView broker simulator when the threshold is breached. On the study version, the stop is executed at the close of the bar.
Step 15. Return to step 3 and select a Trading Mode (Long, Short, BiDir, Ping Pong). If you are planning to trade bidirectionally its best to configure long first then short. Combine them with “BiDir” or “Ping Pong” after setting up both sides of the trade individually. The difference between “BiDir” and “Ping Pong” is that “Ping Pong” uses position reversal and can cut off opposing trades less than the specified minimum profit. As a result “Ping Pong” mode produces the greatest number of trades.
Step 16. Take a look at the chart. Trades should be showing along the markers plotted earlier.
Step 17. Make adjustments to the Vertex fields in Section 2 until the TradingView performance report is showing a profit. This includes the “Minimum Base To Base” fields. If a profit cannot be achieved move on to Step 18. Other adjustments may make a crucial difference.
Step 18. Improve the backtest profitability by adjusting the “Entry Net Change” and “Entry ROC” in Section 3 and 4.
Step 19. Enable the “Mandatory Snap” checkbox in Section 3 and 4 and adjust the “Snap Candle Delta” and “Snap Fractal Delta” in Section 2. This should reduce some chop producing unprofitable reversals.
Step 20. Increase the distance between opposing trades by adding an “Interleave Delta” in Sections 3 and 4. This is a floating point value which starts at 0.01 and typically does not exceed 2.0.
Step 21. Increase the distance between opposing trades even further by adding a “Decay Minimum Span” in Sections 3 and 4. This is an absolute value specified in the symbol’s quote currency (right side scale of the chart). This value is similar to the minimum profit and stop loss fields in Section 1.
Step 22. Improve the backtest profitability by adjusting the “Sparse Delta” in Section 3 and 4.
Step 23. Improve the backtest profitability by adjusting the “Chase Delta” in Section 3 and 4.
Step 24. Improve the backtest profitability by adjusting the “Adherence Delta” in Section 3 and 4. This field requires the “Adhere to Rising Trend” checkbox to be enabled.
Step 25. Try each checkbox in Section 3 and 4. See if it improves the backtest profitability. The “Caution Lackluster” checkbox only works when “Caution Mode” is enabled.
Step 26. Enable the reporting conditions in Section 5. Look for long runs of consecutive losses or high debt sequences. These are indications that your trading system cannot withstand sudden changes in market sentiment.
Step 27. Examine the chart and see that trades are being placed in accordance with your desired trading goals. This is an important step. If your desired model requires multiple trades per day then you should be seeing hundreds of trades on the chart. Alternatively, you may be looking to trade fewer steep peaks and deep valleys in which case you should see trades at major turning points. Don’t simply settle for what the backtest serves you. Work your configuration until the system aligns with your desired model. Try changing indicators and even intervals if you cannot reach your simulation goals. Generally speaking, the histogram and Candle indicators produce the most trades. The Macro indicator captures the tallest peaks and valleys.
Step 28. Apply the backtest settings to the study version and perform forward testing.
This script is open for beta testing. After successful beta test it will become a commercial application available by subscription only. I’ve invested quite a lot of time and effort into making this the best possible signal generator for all of the instruments I intend to trade. I certainly welcome any suggestions for improvements. Thank you all in advance.
One final note. I'm not a fan of having the Performance Overview (blue wedge) automatically show up at the end of the publish page since it could be misleading. On the EUR/USD backtest showing here I used a minimum profit of 65 pips, a stop of 120 pips, the candle indicator and a 5 pyramid max value. Also Mark Pyramid Levels (blue triangles) are enabled along with a 720 ROR Sample Period (red labels).

Backtesting on Non-Standard Charts: Caution! - PineCoders FAQMuch confusion exists in the TradingView community about backtesting on non-standard charts. This script tries to shed some light on the subject in the hope that traders make better use of those chart types.
Non-standard charts are:
Heikin Ashi (HA)
Renko
Kagi
Point & Figure
Range
These chart types are called non-standard because they all transform market prices into synthetic views of price action. Some focus on price movement and disregard time. Others like HA use the same division of bars into fixed time intervals but calculate artificial open, high, low and close (OHLC) values.
Non-standard chart types can provide traders with alternative ways of interpreting price action, but they are not designed to test strategies or run automated traded systems where results depend on the ability to enter and exit trades at precise price levels at specific times, whether orders are issued manually or algorithmically. Ironically, the same characteristics that make non-standard chart types interesting from an analytical point of view also make them ill-suited to trade execution. Why? Because of the dislocation that a synthetic view of price action creates between its non-standard chart prices and real market prices at any given point in time. Switching from a non-standard chart price point into the market always entails a translation of time/price dimensions that results in uncertainty—and uncertainty concerning the level or the time at which orders are executed is detrimental to all strategies.
The delta between the chart’s price when an order is issued (which is assumed to be the expected price) and the price at which that order is filled is called slippage . When working from normal chart types, slippage can be caused by one or more of the following conditions:
• Time delay between order submission and execution. During this delay the market may move normally or be subject to large orders from other traders that will cause large moves of the bid/ask levels.
• Lack of bids for a market sell or lack of asks for a market buy at the current price level.
• Spread taken by middlemen in the order execution process.
• Any other event that changes the expected fill price.
When a market order is submitted, matching engines attempt to fill at the best possible price at the exchange. TradingView strategies usually fill market orders at the opening price of the next candle. A non-standard chart type can produce misleading results because the open of the next candle may or may not correspond to the real market price at that time. This creates artificial and often beneficial slippage that would not exist on standard charts.
Consider an HA chart. The open for each candle is the average of the previous HA bar’s open and close prices. The open of the HA candle is a synthetic value, but the real market open at the time the new HA candle begins on the chart is the unrelated, regular open at the chart interval. The HA open will often be lower on long entries and higher on short entries, resulting in unrealistically advantageous fills.
Another example is a Renko chart. A Renko chart is a type of chart that only measures price movement. The purpose of a Renko chart is to cluster price action into regular intervals, which consequently removes the time element. Because Trading View does not provide tick data as a price source, it relies on chart interval close values to construct Renko bricks. As a consequence, a new brick is constructed only when the interval close penetrates one or more brick thresholds. When a new brick starts on the chart, it is because the previous interval’s close was above or below the next brick threshold. The open price of the next brick will likely not represent the current price at the time this new brick begins, so correctly simulating an order is impossible.
Some traders have argued with us that backtesting and trading off HA charts and other non-standard charts is useful, and so we have written this script to show traders what happens when order fills from backtesting on non-standard charts are compared to real-world fills at market prices.
Let’s review how TV backtesting works. TV backtesting uses a broker emulator to execute orders. When an order is executed by the broker emulator on historical bars, the price used for the fill is either the close of the order’s submission bar or, more often, the open of the next. The broker emulator only has access to the chart’s prices, and so it uses those prices to fill orders. When backtesting is run on a non-standard chart type, orders are filled at non-standard prices, and so backtesting results are non-standard—i.e., as unrealistic as the prices appearing on non-standard charts. This is not a bug; where else is the broker emulator going to fetch prices than from the chart?
This script is a strategy that you can run on either standard or non-standard chart types. It is meant to help traders understand the differences between backtests run on both types of charts. For every backtest, a label at the end of the chart shows two global net profit results for the strategy:
• The net profits (in currency) calculated by TV backtesting with orders filled at the chart’s prices.
• The net profits (in currency) calculated from the same orders, but filled at market prices (fetched through security() calls from the underlying real market prices) instead of the chart’s prices.
If you run the script on a non-standard chart, the top result in the label will be the result you would normally get from the TV backtesting results window. The bottom result will show you a more realistic result because it is calculated from real market fills.
If you run the script on a normal chart type (bars, candles, hollow candles, line, area or baseline) you will see the same result for both net profit numbers since both are run on the same real market prices. You will sometimes see slight discrepancies due to occasional differences between chart prices and the corresponding information fetched through security() calls.
Features
• Results shown in the Data Window (third icon from the top right of your chart) are:
— Cumulative results
— For each order execution bar on the chart, the chart and market previous and current fills, and the trade results calculated from both chart and market fills.
• You can choose between 2 different strategies, both elementary.
• You can use HA prices for the calculations determining entry/exit conditions. You can use this to see how a strategy calculated from HA values can run on a normal chart. You will notice that such strategies will not produce the same results as the real market results generated from HA charts. This is due to the different environment backtesting is running on where for example, position sizes for entries on the same bar will be calculated differently because HA and standard chart close prices differ.
• You can choose repainting/non-repainting signals.
• You can show MAs, entry/exit markers and market fill levels.
• You can show candles built from the underlying market prices.
• You can color the background for occurrences where an order is filled at a different real market price than the chart’s price.
Notes
• On some non-standard chart types you will not obtain any results. This is sometimes due to how certain types of non-standard types work, and sometimes because the script will not emit orders if no underlying market information is detected.
• The script illustrates how those who want to use HA values to calculate conditions can do so from a standard chart. They will then be getting orders emitted on HA conditions but filled at more realistic prices because their strategy can run on a standard chart.
• On some non-standard chart types you will see market results surpass chart results. While this may seem interesting, our way of looking at it is that it points to how unreliable non-standard chart backtesting is, and why it should be avoided.
• In order not to extend an already long description, we do not discuss the particulars of executing orders on the realtime bar when using non-standard charts. Unless you understand the minute details of what’s going on in the realtime bar on a particular non-standard chart type, we recommend staying away from this.
• Some traders ask us: Why does TradingView allow backtesting on non-standard chart types if it produces unrealistic results? That’s somewhat like asking a hammer manufacturer why it makes hammers if hammers can hurt you. We believe it’s a trader’s responsibility to understand the tools he is using.
Takeaways
• Non-standard charts are not bad per se, but they can be badly used.
• TV backtesting on non-standard charts is not broken and doesn’t require fixing. Traders asking for a fix are in dire need of learning more about trading. We recommend they stop trading until they understand why.
• Stay away from—even better, report—any vendor presenting you with strategies running on non-standard charts and implying they are showing reliable results.
• If you don’t understand everything we discussed, don’t use non-standard charts at all.
• Study carefully how non-standard charts are built and the inevitable compromises used in calculating them so you can understand their limitations.
Thanks to @allanster and @mortdiggiddy for their help in editing this description.
Look first. Then leap.

Donchian Channel StrategyIf you've read , you must be familiar with Donchian Channel Strategy. This is the second time I share this strategy because of not using English in the last publishment.
Actually, there is a build-in strategy called Channel Break Out Strategy. It is a kind of simplified version of Donchain Channel Strategy. The strategy I share today is complete Donchain Channel Strategy.
There are two differences between this strategy and Build-in Channel Break Out Strategy:
1. Channel Break Out Strategy is always in the market. According to the Channel Break Out Strategy, assuming that you held a long position at first, you will open a short position immediately if you close the long position. It is my script that makes an improvement in this aspect. You can make a distinction between closing long position and open a short position in my script and the time for entering and exiting market can be adjusted by yourself based on 4 parameters.
2. Market trends are taken into account in my script. A short Exponential Moving Average and a long Exponential Moving Average are added to this strategy. You can open a long position only when short EMA is higher then long EMA. On the contrary, short EMA being lower then long EMA is a prerequisite for open a short position.
You can adjust 4 parameters in my script. In the end, I'd like to remind you that different combination of parameters applies to different time period. The default parameters may fit 30M candle and you can try combination of 8-4-5-15 in 1D candle. Of course, you can try another combination of parameters in other time period.
I will write some simple strategies in the future if time allows. So, welcome to follow me if my script can profit you. Happy trading!

Understanding order sizestype: properties manipulation, no programming needed
time required: 15minutes, at least
level: medium (need to know contracts, trading pairs)
A strategy can "appear" to work or be broken depending on the pile of cash that is working on. This amount is defined in the strat properties, under "order size".
For noobs (like me) this is very confusing at first :)
A strat opens/closes positions using units, a generic measure for the chart being operated on. Thes "units" can be a fixed amount of cash, a fixed amount of contracts, or a floating amount based on the last profits made. I recommend checking my previous strat to figure the case of contracts .
So, any trading price is the amount of "things" you get for some "cash". The things are the first unit, the "cash" is the second. Some examples:
XAU/USD - 1 xau oz is worth x dollars
BTC/USD - 1 bitcoin is worth x dollars
GBP/EUR - 1 pound is worth x euros
To add to confusion, a lot of markets the "unit size" is different from what the strat thinks it is. An options contract is 100 shares(the unit), 1 xau contract is 10 oz(units), 1 eur/usd contract is 100k euros and so on... so, after figuring out how the sizes work in a strat, then the sizes must be adapted for the specific market in question.
The choice os using the ETHUSD pair is because:
1 - you can buy 1eth, unlike a gold contract for example, so 1 "unit" = 1 eth, easier to get
2 - ETH is around 12 bucks, wich gives round numbers on the math, easier to wrap the brains around :)
3- is an unusual pair, so the regular contract sizes don't apply, and the brain is not conditioned to work inside the box ;)
You will have to access the script properties, to change the values. As these values are changed you will see exactly the differences in the values of the strat.
Text is too long, check the comments for all the cases
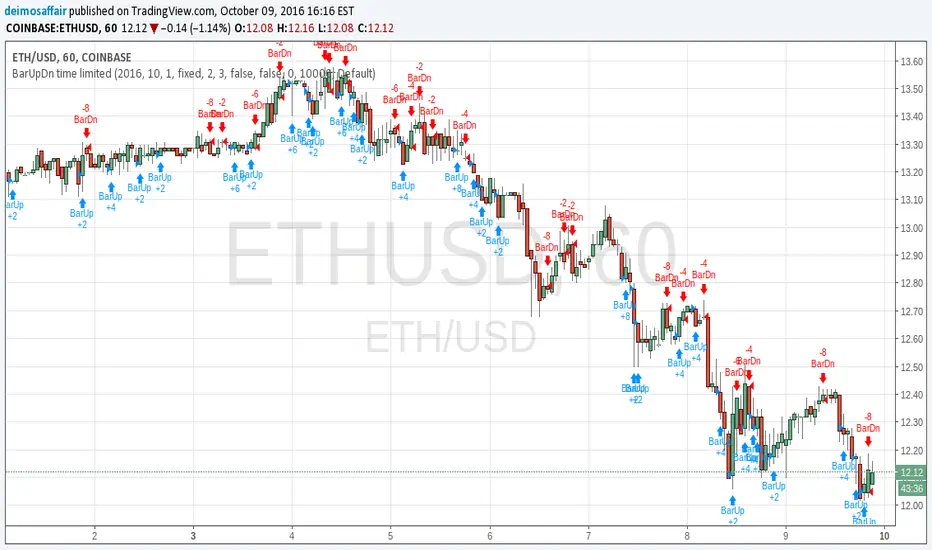
Understanding contract sizes in a strategyThis simple strat fires up on green bars, down on red bars. cannot get any simpler. So, it's a good example to check how returns are calculated.
First, the internal firing mechanism for the strategy.entry function is something hardcore. As result, the entry points can be confusing, and seem to appear in a wrong bar (as the 2nd and 3rd signals are good examples), but i'll put that aside to keep it simple. And, because i don't yet get it myself ;)
The example is simple, so that numbers can be followed easy. Chart in BTC/USD, so USD is the "base" currency used by strat to calculate. A contract/unit is the value of 1 unit in base currency. 1 Apple share is 600$, 1 bitcoin is 600$, 1 oz gold is 1330 bucks. So, here in each bar, the value of 1 contract is the value of the BTC in USD. simple as that.
The strat properties, can be passed as input fields (line 2) or accessed/changed in the right click->properties pop-up. To make it easier, initial capital is 1000 bucks, and "order size" is 1 contract. This means that the strat will open a position of 1 BTC when it fires. Value "Initial capital" makes no difference at all, at least with these choices. It's just for show. Try to put 1$ and 1 contract, the strat will still trade anyway. It manages to trade 1 contract(or BTC) values at ~600$, with a single dollar. nice ;)
Check the chart. see the little blue "BarUp +1" ? that's it, strat goes long 1 BTC. there's a little blue triangle on the bar, points to the value of entry.
Then later, on second move, the "BarDn -2", the strat goes short 2BTC. 1BTC to close the long +1 more to open a short.
The profit here is the difference between the value of the long opening and the long closing. The extra BTC (shorted) is part of the next position. Since this dumb strat just reverses the direction, there are always +2, -2 , +2.... 1 to close previous position, 1 to open another. At the strategy tester tab, the option "list of trades" shows in details each of the moves
Checking each move and comparing what we see with the chart itself helps to achieve ilumination :)
Bonus feature: as soon as you get it, try to increase the option "pyramiding" and see how the strat adds more contracts, and how it reverses the positions. sometimes it even makes sense!!!! :)

Super-AO with Risk Management Strategy Template - 11-29-25Super-AO Strategy with Advanced Risk Management Template
Signal Lynx | Free Scripts supporting Automation for the Night-Shift Nation 🌙
1. Overview
Welcome to the Super-AO Strategy. This is more than just a buy/sell indicator; it is a complete, open-source Risk Management (RM) Template designed for the Pine Script community.
At its core, this script implements a robust swing-trading strategy combining the SuperTrend (for macro direction) and the Awesome Oscillator (for momentum). However, the real power lies under the hood: a custom-built Risk Management Engine that handles trade states, prevents repainting, and manages complex exit conditions like Staged Take Profits and Advanced Adaptive Trailing Stops (AATS).
We are releasing this code to help traders transition from simple indicators to professional-grade strategy structures.
2. Quick Action Guide (TL;DR)
Best Timeframe: 4 Hours (H4) and above. Designed for Swing Trading.
Best Assets: "Well-behaved" assets with clear liquidity (Major Forex pairs, BTC, ETH, Indices).
Strategy Type: Trend Following + Momentum Confirmation.
Key Feature: The Risk Management Engine is modular. You can strip out the "Super-AO" logic and insert your own strategy logic into the template easily.
Repainting: Strictly Non-Repainting. The engine calculates logic based on confirmed candle closes.
3. Detailed Report: How It Works
A. The Strategy Logic: Super-AO
The entry logic is based on the convergence of two classic indicators:
SuperTrend: Determines the overall trend bias (Green/Red).
Awesome Oscillator (AO): Measures market momentum.
The Signal:
LONG (+2): SuperTrend is Green AND AO is above the Zero Line AND AO is Rising.
SHORT (-2): SuperTrend is Red AND AO is below the Zero Line AND AO is Falling.
By requiring momentum to agree with the trend, this system filters out many false signals found in ranging markets.
B. The Risk Management (RM) Engine
This script features a proprietary State Machine designed by Signal Lynx. Unlike standard strategies that simply fire orders, this engine separates the Signal from the Execution.
Logic Injection: The engine listens for a specific integer signal: +2 (Buy) or -2 (Sell). This makes the code a Template. You can delete the Super-AO section, write your own logic, and simply pass a +2 or -2 to the RM_EngineInput variable. The engine handles the rest.
Trade States: The engine tracks the state of the trade (Entry, In-Trade, Exiting) to prevent signal spamming.
Aggressive vs. Conservative:
Conservative Mode: Waits for a full trend reversal before taking a new trade.
Aggressive Mode: Allows for re-entries if the trend is strong and valid conditions present themselves again (Pyramiding Type 1).
C. Advanced Exit Protocols
The strategy does not rely on a single exit point. It employs a "Layered Defense" approach:
Hard Stop Loss: A fixed percentage safety net.
Staged Take Profits (Scaling Out): The script allows you to set 3 distinct Take Profit levels. For example, you can close 10% of your position at TP1, 10% at TP2, and let the remaining 80% ride the trend.
Trailing Stop: A standard percentage-based trailer.
Advanced Adaptive Trailing Stop (AATS): This is a highly sophisticated volatility stop. It calculates market structure using Hirashima Sugita (HSRS) levels and Bollinger Bands to determine the "floor" and "ceiling" of price action.
If volatility is high: The stop loosens to prevent wicking out.
If volatility is low: The stop tightens to protect profit.
D. Repainting Protection
Many Pine Script strategies look great in backtesting but fail in live trading because they rely on "real-time" price data that disappears when the candle closes.
This Risk Management engine explicitly pulls data from the previous candle close (close , high , low ) for its calculations. This ensures that the backtest results you see match the reality of live execution.
4. For Developers & Modders
We encourage you to tear this code apart!
Look for the section titled // Super-AO Strategy Logic.
Replace that block with your own RSI, MACD, or Price Action logic.
Ensure your logic outputs a 2 for Buy and -2 for Sell.
Connect it to RM_EngineInput.
You now have a fully functioning Risk Management system for your custom strategy.
5. About Signal Lynx
Automation for the Night-Shift Nation 🌙
This code has been in action since 2022 and is a known performer in PineScript v5. We provide this open source to help the community build better, safer automated systems.
If you are looking to automate your strategies, please take a look at Signal Lynx in your search.
License: Mozilla Public License 2.0 (Open Source). If you make beneficial modifications, please release them back to the community!

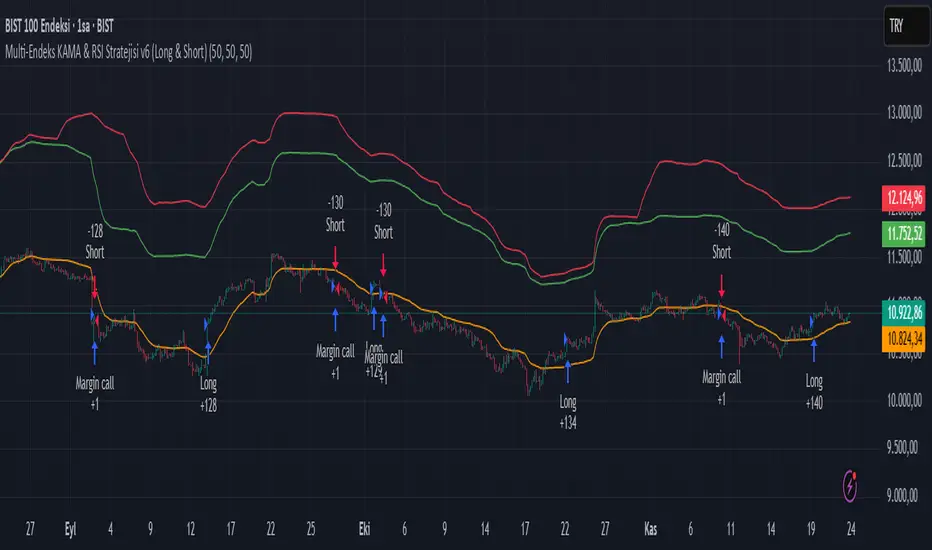
Multi-Endeks KAMA & RSI Stratejisi v6 (Long & Short)Multi-Index KAMA & RSI Strategy v6 (Long & Short)
This is a hybrid trading strategy that combines two powerful technical analysis tools—the Kaufman's Adaptive Moving Average (KAMA) for trend following and the Relative Strength Index (RSI) for measuring momentum and identifying overbought/oversold conditions.
The term "Multi-Index" suggests that the decision-making process might incorporate data or conditions from several different market indices or timeframes, rather than just the single asset being traded.
🧭 Core Components
1. KAMA (Kaufman's Adaptive Moving Average)
KAMA is an adaptive moving average developed by quantitative financial theorist Perry J. Kaufman.
Adaptivity: Unlike standard moving averages, KAMA automatically adjusts its smoothing factor (speed) based on market volatility.
Mechanism:
Trending Markets (Low Noise): When prices move clearly in one direction (low volatility), KAMA speeds up, hugging the price closely and providing fast signals.
Sideways Markets (High Noise): When prices are choppy (high volatility/noise), KAMA slows down, smoothing out price fluctuations to reduce the risk of whipsaws (false signals).
Role in Strategy: To define the main trend direction. The position of the price relative to the KAMA line determines the base directional bias (Long or Short).
2. RSI (Relative Strength Index)
RSI is a momentum oscillator developed by J. Welles Wilder Jr. that measures the speed and change of price movements.
Overbought/Oversold: It oscillates between 0 and 100. Conventionally, a reading above 70 suggests overbought conditions (potential sell signal), and a reading below 30 suggests oversold conditions (potential buy signal).
Role in Strategy: Timing and Confirmation. Once the trend is confirmed by KAMA, the RSI acts as a timing filter, often confirming an entry as it moves away from extreme overbought (for Short) or oversold (for Long) levels.
📉 Potential Trading Logic (V6)
This "v6" strategy likely aims to capture more reliable entries by requiring both trend (KAMA) and momentum (RSI) alignment:
1. LONG (Buy) Entry Conditions
Trend Confirmation (KAMA): The asset's price (Closing Price) must be above the KAMA line (confirming an uptrend).
Momentum Confirmation (RSI):
Option A (Reversal): The RSI must cross above the 30 level (exiting oversold) or decisively move above the 50 level.
Option B (Trend-Continuation): In a strong uptrend, the RSI might bounce off the 40-50 zone and turn upwards, confirming trend continuation.
2. SHORT (Sell) Entry Conditions
Trend Confirmation (KAMA): The asset's price (Closing Price) must be below the KAMA line (confirming a downtrend).
Momentum Confirmation (RSI):
Option A (Reversal): The RSI must cross below the 70 level (exiting overbought) or decisively move below the 50 level.
Option B (Trend-Continuation): In a strong downtrend, the RSI might be rejected from the 50-60 zone and turn downwards, confirming continuation.
3. Exit Management
The strategy likely utilizes dynamic risk controls:
Stop-Loss: A dynamic stop placed on the opposite side of the KAMA, or an ATR-based distance to adjust to volatility.
Take-Profit: Conditions such as the RSI reaching extreme levels or the KAMA line being crossed in the reverse direction.
🌟 Implication of the "V6" Version
The "v6" designation implies that the strategy has been refined and iterated upon over time to address weaknesses in prior versions (v1, v2, etc.). These improvements might include:
Filters: Adding stricter RSI or KAMA cross filters to reduce false signals.
Multi-Index Logic: Using the RSI or KAMA of a secondary instrument (e.g., a major index or volatility measure) as a macro filter for the main trade execution.
Optimization: Optimizing the default lookback periods for KAMA and RSI for different asset classes.
PA Builder [PrimeAutomation]1. PA Builder – Overview
PA Builder is not a fixed strategy; it’s a framework for building strategies. Instead of giving traders one rigid system, it provides a toolbox where entries, exits, filters, risk parameters, and automation rules can all be defined and combined. The core philosophy is confluence: the idea that a trade should only be taken when multiple independent signals agree. The Builder is built around this principle. Every module; trend, reactors, bands, reversals, volume, structure, divergences, externals can be treated as one layer of confidence. The stronger the alignment across layers, the higher the quality of the setup in theory.
In practice, this means PA Builder encourages traders to think in terms of “confluence,” not single indicators. Trend and positioning define whether you should even be looking for longs or shorts. Timing tools such as bands, reversals and candlestick structures determine when inside that broader bias you want to engage. Confirmation tools like volume and flow tell you whether capital is actually supporting the move. Filter systems then ensure that even if everything looks good locally, you still respect higher-timeframe or opposing warnings. The Builder’s philosophy is simple: enter less often, but only when conditions are genuinely in your favour.
2. Core Entry Signal Components
The entry logic in PA Builder is built on a set of signal engines that can be combined in many ways. Trend Signals form a natural foundation. They use low-lag low-pass filters, borrowed from audio signal processing, to extract directional bias from price without the classic delay of classical moving averages. The sensitivity parameter controls how reactive this engine is: lower values favour cleaner trends and fewer whipsaws, while higher values are better suited to short-term intraday trading where speed matters more than smoothness. Many traders start by requiring that Trend Signals show “all bullish” or “all bearish” before allowing any entries in that direction.
Trend signals firing short positions
On top of this directional backbone, the Dynamic Reactor behaves as an adaptive baseline. It accelerates in volatile phases and slows down during consolidation, effectively acting as a moving reference point for both trend and price position. A typical use of this module is to insist that, for long trades, the price sits above a bullish reactor; for shorts, below a bearish one. At the higher-timeframe level, the Quantum Reactor provides a VWAP-style reference that can be anchored to larger candles than the chart you are trading. A common configuration is to trade on a 15-minute chart while requiring that price is above the 4-hour Quantum Reactor for longs or below it for shorts. The “fast” and “slow” options determine how quickly this reference adapts to new information.
Timing is then refined with tools like Quantum Bands, reversals and candle structure analysis. Quantum Bands identify extremes within the current environment. In an uptrend, a tag of the lower band can be treated as a pullback rather than a breakdown; in a downtrend, the upper band acts like a shorting zone. Many traders combine “trend up and above higher-timeframe reactor” with “price temporarily below lower band” to construct a mean-reversion entry inside a larger uptrend. Reversal detection modules examine recent bars to find turning points, with shorter lookbacks capturing fast flips and longer lookbacks tracking deeper structural changes. Candle structure logic goes beyond classical candlestick names and instead focuses on whether price action confirms follow-through or reversion behaviour, with options like “2X” modes that wait for two successive confirmations before acting.
Before and after filtering using reactor applied.
Additional confirmation layers come from Volume Matrix, Money Flow, OSC True7 and divergence detection. Volume and flow tools answer whether actual capital is participating in the move or whether price is drifting on thin activity. OSC True7 categorises the state of the trend into intuitive buckets, strong, healthy, neutral, or exhausted, making it easier to avoid chasing extremes. Divergences between price and momentum can be used either as entry triggers in contrarian systems or as hard filters that block trades when warning signs are present. Finally, two external indicator inputs make it possible to integrate RSI, MACD, custom indicators or even other strategies into the Builder, either as simple thresholds or as comparative logic between two external sources (for example, requiring a fast EMA to be above a slow EMA before allowing longs).
3. Exit System & Trade Management
The exit systems in PA Builder are designed to be as vital as the entry logic. It assumes exits are not an afterthought, but half of the edge. Instead of forcing a single take profit point, the system uses a three-tier structure where you can assign different portions of the position to different targets. A common pattern is to scale out a small portion early (for example at one ATR), another portion at an intermediate level, and keep the largest slice for a deeper move. This creates a natural balance: you book something early to reduce emotional stress, while leaving room to participate in the full potential of a trend.
Targets can be defined using ATR multiples or risk-to-reward ratios that are directly tied to the initial stop distance. Using ATR keeps exits proportional to current volatility. A two ATR target in a quiet environment is very different in absolute price distance from the same multiple in a high-volatility environment, yet conceptually it represents the same “size” move. Risk-to-reward exits build on this by ensuring that if you risk one unit (1R), the reward targets are set at predefined multiples of that risk. This enforces positive expectancy at the structural level: the strategy cannot generate entries with inherently negative payoffs.
Once price begins to move in your favour, trailing logic takes over if you choose to enable it. Trailing can begin immediately from entry or only after a target has been hit. Many users prefer to let TP1 and TP2 behave as fixed profit points and then apply a trailing stop or trailing take profit to the final remainder. That way, routine winners are banked mechanically, while occasional explosive moves can be ridden for as long as the market allows. The breakeven module supports this behaviour by automatically moving stops to entry (or slightly through entry into profit) after a specified condition such as TP1 being hit. This transforms the risk profile mid trade: once breakeven has been secured, remaining size can be managed with much less psychological pressure.
The system also recognises the cost of time. Kill Switch functionality exits trades that have been open too long under mediocre conditions, typically when they are in modest profit but not progressing. This protects you from capital being tied up while better opportunities appear elsewhere. Underlying all of this are several trailing stop mechanisms: percentage-based, tick-based for very short-term strategies, TP linked trailing that activates only once a certain profit threshold has been achieved, and ATR based trailing that automatically scales the trail distance with volatility. Each method serves a slightly different profile of strategy, but all share the same aim: preserve gains and limit downside in a structured way rather than rely on discretionary judgement after the fact.
4. Filters and Risk Management
The filter systems in PA Builder formalise the idea that good trading is often about knowing when not to act. “Do Not Trade” conditions can be configured so that even a perfectly aligned bullish entry stack is overridden if certain bearish evidence is present. These can include higher timeframe reversal structures, powerful opposing divergences, or conflicting signals in key modules. By assigning conditions specifically to “Do Not Long” and “Do Not Short” rather than only to entries, you create asymmetry: buying requires bullish evidence and an absence of strong bearish warnings; selling requires the mirror.
Volatility filters extend this logic to the regime level. Some strategies are inherently suited to low volatility, range bound environments where fading extremes is profitable; others require expansion and energy to function properly. By binding trading permission to volatility ranges, you ensure that a mean-reversion system does not blindly attempt to fade a breakout, and that a momentum system does not spin its wheels in a dead, sideways market. You can even reference volatility from a higher timeframe than the one you trade, so that a five-minute strategy is still aware of the broader one-hour volatility regime it sits inside.
Applied DO NOT TRADE - removes poor signal
Risk management and position sizing are configured so each trade is expressed in units of risk rather than arbitrary size. Leverage, in this framework, is simply a scaling factor for capital efficiency; the actual risk per trade is still controlled by the distance between entry and stop and the percentage of equity you choose to expose. Reinvestment options then decide what proportion of accumulated profit is fed back into position sizing. A more aggressive reinvestment setting accelerates compounding but increases the amplitude of drawdowns; a more conservative one smooths the equity curve at the cost of slower growth. The Base Trade Value parameter ties all of this together by deciding how much nominal capital or how many contracts are committed per trade in light of your maximum allowed simultaneous positions and your intended use of leverage.
External exit conditions provide further flexibility. For example, you might design a system whose entries rely purely on PA Builder’s internal modules, but whose exits use RSI readings, moving average crosses, or a proprietary external indicator. The separation of entry and exit logic allows you to bolt on different behaviours at the tail end of trades while keeping your core signal engine intact. In all cases, the objective is the same: express risk in a controlled, repeatable way that can survive long stretches of unfavourable market conditions.
5. PDT, Cooldowns and Visual Modes
For traders subject to Pattern Day Trading rules, PA Builder includes a day-trade tracking system that counts business days correctly and respects the three-trades-in-five-days limit. This goes beyond simple compliance; it forces discipline. When intraday trading is heavily constrained, you are naturally pushed toward swing-oriented strategies with fewer, more selective entries. The tool visually marks your PDT status so you never inadvertently cross the line and trigger a lockout.
Cooldown systems address another reality: psychological vulnerability after streaks. Following several consecutive wins, many traders unconsciously loosen their standards, take marginal signals, oversize positions, or overtrade. A win-streak cooldown deliberately pauses trading after a configured number of wins, giving you time to reset. The same applies to losing streaks. After a run of losses, the strongest temptation is often to “make it back now,” which is exactly when discipline is weakest. A loss-streak cooldown enforces a break in activity during this high-risk emotional state, helping to prevent cascading damage driven by revenge trading.
Visualisation comes in two main modes. Classic mode emphasises precision: it draws explicit entry lines, stop levels, target levels and fill zones, making it easy to audit risk/reward on each trade, verify that the exit logic behaves as intended, and review historical trades in detail. Modern mode emphasises market feel: instead of focusing on exact levels, it colours candles and backgrounds to reflect momentum, profit state and dynamics.
This helps you see at a glance whether a strategy is operating in a smooth trending environment or a choppy, fragmented one, and whether current trades are broadly working or struggling. Many users develop and debug in Classic mode and then monitor live performance in Modern mode, so both representations become part of the workflow.
6. Strategy Design Workflow, Examples and Cautions
Designing with PA Builder is inherently iterative. You begin with a simple theory and a minimal configuration, perhaps just a trend filter and a basic stop/target structure, and run a backtest. You then examine where the system fails. If you see many losses occurring in counter-trend conditions, you add an additional directional filter or restrict entries with a higher-timeframe reactor condition. If you observe many small whipsaw losses, you might require candle structure confirmation or volume confirmation before allowing an entry. Each change is made one at a time and evaluated. This process gradually builds a layered system where every component has a clear purpose: some reduce drawdown, some increase win rate, some cut out only the worst trades, and others help capture more of the best ones.
A conservative swing strategy might need an agreement between short-term trend signals, a higher-timeframe Quantum position, and a bullish Dynamic Reactor state, while checking that volume supports the move and that no significant bearish reversals or divergences are present on higher timeframes. It might accept relatively few trades, but each trade would be tightly controlled, scaled out over several ATR-based targets and protected with breakeven and trailing logic. On the opposite end, an aggressive scalping configuration would relax some filters, favour faster sensitivities, use short lookback reversals, and tighten stops and targets dramatically, relying on high frequency and careful volatility filtering to maintain edge.
Throughout all of this, overfitting remains the main danger. The more parameters you tune and the more coincidental rules you add to make the backtest equity curve smoother, the more likely it is that you are capturing noise rather than a real, repeatable edge. Signs of overfitting include heavily optimised numeric values with no intuitive justification, large differences between in-sample and out-of-sample results, or strategies that work spectacularly in very specific regimes and collapse elsewhere. To mitigate this, keep strategies as simple as possible, test across different market regimes (bull, bear, range), and accept that robust systems usually look less “perfect” on the historical chart.
Bridging the gap from backtest to live trading is another critical step. Before risking capital, it is wise to paper trade the configuration for a number of trades to confirm that signal frequency, behaviour and execution align with expectations. When going live, starting with minimal size and gradually scaling up based on real-world performance helps manage both financial and psychological risk. If live results diverge significantly from backtest expectations due to slippage, fees, or changing market conditions, you can adjust, reduce size, or temporarily pause rather than commit fully to a failing configuration.
Ultimately, PA Builder is designed to be a tool for building structured, rules-driven trading systems. It gives you the tools to express your ideas, test them, refine them, and run them under controlled risk. It does not remove uncertainty or guarantee results, but it does provide a clear, transparent way to translate trading concepts into executable, testable logic, and to evolve those systems as markets change and your understanding deepens.

ATH대비 지정하락률에 도착 시 매수 - 장기홀딩 선물 전략(ATH Drawdown Re-Buy Long Only)본 스크립트는 과거 하락 데이터를 이용하여, 정해진 하락 %가 발생하는 경우 자기 자본의 정해진 %만큼을 진입하게 설계되어진 스트레티지입니다.
레버리지를 사용할 수 있으며 기본적으로 셋팅해둔 값이 내장되어있습니다.(자유롭게 바꿔서 쓰시면 됩니다.) 추가적으로 2번의 진입 외에도 다른 진입 기준, 진입 %를 설정하실 수 있으며 - ChatGPT에게 요청하면 수정해줄 것입니다.
실제 사용용도로는 KillSwitch 기능을 꺼주세요. 바 돋보기 기능을 켜주세요.
ATH Drawdown Re-Buy Long Only 전략 설명
1. 전략 개요
ATH Drawdown Re-Buy Long Only 전략은 자산의 역대 최고가(ATH, All-Time High)를 기준으로 한 하락폭(드로우다운)을 활용하여,
특정 구간마다 단계적으로 롱 포지션을 구축하는 자동 재매수(Long Only) 전략입니다.
본 전략은 다음과 같은 목적을 가지고 설계되었습니다.
급격한 조정 구간에서 체계적인 분할 매수 및 레버리지 활용
ATH를 기준으로 한 명확한 진입 규칙 제공
실시간으로
평단가
레버리지
청산가 추정
계좌 MDD
수익률
등을 시각적으로 제공하여 리스크와 포지션 상태를 직관적으로 확인할 수 있도록 지원
※ 본 전략은 교육·연구·백테스트 용도로 제공되며,
어떠한 형태의 투자 권유 또는 수익을 보장하지 않습니다.
2. 전략의 핵심 개념
2-1. ATH(역대 최고가) 기준 드로우다운
전략은 차트 상에서 항상 가장 높은 고가(High)를 ATH로 기록합니다.
새로운 고점이 형성될 때마다 ATH를 갱신하고, 해당 ATH를 기준으로 다음을 계산합니다.
현재 바의 저가(Low)가 ATH에서 몇 % 하락했는지
현재 바의 종가(Close)가 ATH에서 몇 % 하락했는지
그리고 사전에 설정한 두 개의 드로우다운 구간에서 매수를 수행합니다.
1차 진입 구간: ATH 대비 X% 하락 시
2차 진입 구간: ATH 대비 Y% 하락 시
각 구간은 ATH가 새로 갱신될 때마다 한 번씩만 작동하며,
새로운 ATH가 생성되면 다시 “1차 / 2차 진입 가능 상태”로 초기화됩니다.
2-2. 첫 포지션 100% / 300% 특수 규칙
이 전략의 중요한 특징은 **“첫 포지션 진입 시의 예외 규칙”**입니다.
전략이 현재 어떠한 포지션도 들고 있지 않은 상태에서
최초로 롱 포지션을 진입하는 시점(첫 포지션)에 대해:
기본적으로는 **자산의 100%**를 기준으로 포지션을 구축하지만,
만약 그 순간의 가격이 ATH 대비 설정값 이상(예: 약 –72.5% 이상 하락한 상황) 이라면
→ 자산의 300% 규모로 첫 포지션을 진입하도록 설계되어 있습니다.
이 규칙은 다음과 같이 동작합니다.
첫 진입이 1차 드로우다운 구간에서 발생하든,
첫 진입이 2차 드로우다운 구간에서 발생하든,
현재 하락폭이 설정된 기준 이상(예: –72.5% 이상) 이라면
→ “이 정도 하락이면 첫 진입부터 더 공격적으로 들어간다”는 의미로 300% 규모로 진입
그 이하의 하락폭이라면
→ 첫 진입은 100% 규모로 제한
즉, 전략은 다음 두 가지 모드로 동작합니다.
일반적인 상황의 첫 진입: 자산의 100%
심각한 드로우다운 구간에서의 첫 진입: 자산의 300%
이 특수 규칙은 깊은 하락에서는 공격적으로, 평소에는 상대적으로 보수적으로 진입하도록 설계된 것입니다.
3. 전략 동작 구조
3-1. 매수 조건
차트 상 High 기준으로 ATH를 추적합니다.
각 바마다 해당 ATH에서의 하락률을 계산합니다.
사용자가 설정한 두 개의 드로우다운 구간(예시):
1차 구간: 예를 들어 ATH – 50%
2차 구간: 예를 들어 ATH – 72.5%
각 구간에 대해 다음과 같은 조건을 확인합니다.
“이번 ATH 구간에서 아직 해당 구간 매수를 한 적이 없는 상태”이고,
현재 바의 저가(Low)가 해당 구간 가격 이하를 찍는 순간
→ 해당 바에서 매수 조건 충족으로 간주
실제 주문은:
해당 구간 가격에 맞춰 롱 포지션 진입(리밋/시장가 기반 시뮬레이션) 으로 처리됩니다.
3-2. ATH 갱신과 진입 기회 리셋
차트 상에서 새로운 고점(High)이 기존 ATH를 넘어서는 순간,
ATH가 갱신되고,
1차 / 2차 진입 여부를 나타내는 내부 플래그가 초기화됩니다.
이를 통해, 시장이 새로운 고점을 돌파해 나갈 때마다,
해당 구간에서 다시 한 번씩 1차·2차 드로우다운 진입 기회를 갖게 됩니다.
4. 포지션 사이징 및 레버리지
4-1. 계좌 자산(Equity) 기준 포지션 크기 결정
전략은 현재 계좌 자산을 다음과 같이 정의하여 사용합니다.
현재 자산 = 초기 자본 + 실현 손익 + 미실현 손익
각 진입 구간에서의 포지션 가치는 다음과 같이 결정됩니다.
1차 진입 구간:
“자산의 몇 %를 사용할지”를 설정값으로 입력
설정된 퍼센트를 계좌 자산에 곱한 뒤,
다시 전략 내 레버리지 배수(Leverage) 를 곱하여 실제 포지션 가치를 계산
2차 진입 구간:
동일한 방식으로, 독립된 퍼센트 설정값을 사용
즉, 포지션 가치는 다음과 같이 계산됩니다.
포지션 가치 = 현재 자산 × (해당 구간 설정 % / 100) × 레버리지 배수
그리고 이를 해당 구간의 진입 가격으로 나누어 실제 수량(토큰 단위) 를 산출합니다.
4-2. 첫 포지션의 예외 처리 (100% / 300%)
첫 포지션에 대해서는 위의 일반적인 퍼센트 설정 대신,
다음과 같은 고정 비율이 사용됩니다.
기본: 자산의 100% 규모로 첫 포지션 진입
단, 진입 시점의 ATH 대비 하락률이 설정값 이상(예: –72.5% 이상) 일 경우
→ 자산의 300% 규모로 첫 포지션 진입
이때 역시 다음 공식을 사용합니다.
포지션 가치 = 현재 자산 × (100% 또는 300%) × 레버리지
그리고 이를 가격으로 나누어 실제 진입 수량을 계산합니다.
이 규칙은:
첫 진입이 1차 구간이든 2차 구간이든 동일하게 적용되며,
“충분히 깊은 하락 구간에서는 첫 진입부터 더 크게,
평소에는 비교적 보수적으로” 라는 운용 철학을 반영합니다.
4-3. 실레버리지(Real Leverage)의 추적
전략은 각 바 단위로 다음을 추적합니다.
바가 시작할 때의 기존 포지션 크기
해당 바에서 새로 진입한 수량
이를 바탕으로, 진입이 발생한 시점에 다음을 계산합니다.
실제 레버리지 = (포지션 가치 / 현재 자산)
그리고 차트 상에 예를 들어:
Lev 2.53x 와 같은 형식의 레이블로 표시합니다.
이를 통해, 매수 시점마다 실제 계좌 레버리지가 어느 정도였는지를 직관적으로 확인할 수 있습니다.
5. 시각화 및 모니터링 요소
5-1. 차트 상 시각 요소
전략은 차트 위에 다음과 같은 정보를 직접 표시합니다.
ATH 라인
High 기준으로 계산된 역대 최고가를 주황색 선으로 표시
평단가(평균 진입가) 라인
현재 보유 포지션이 있을 때,
해당 포지션의 평균 진입가를 노란색 선으로 표시
추정 청산가(고정형 청산가) 라인
포지션 수량이 변화하는 시점을 감지하여,
당시의 평단가와 실제 레버리지를 이용해 근사적인 청산가를 계산
이를 빨간색 선으로 차트에 고정 표시
포지션이 없거나 레버리지가 1배 이하인 경우에는 청산가 라인을 제거
매수 마커 및 레이블
1차/2차 매수 조건이 충족될 때마다 해당 지점에 매수 마커를 표시
"Buy XX% @ 가격", "Lev XXx" 형태의 라벨로
진입 비율과 당시 레버리지를 함께 시각화
레이블의 위치는 설정에서 선택 가능:
바 아래 (Below Bar)
바 위 (Above Bar)
실제 가격 위치 (At Price)
5-2. 우측 상단 정보 테이블
차트 우측 상단에는 현재 계좌·포지션 상태를 요약한 정보 테이블이 표시됩니다.
대표적으로 다음 항목들이 포함됩니다.
Pos Qty (Token)
현재 보유 중인 포지션 수량(토큰 기준, 절대값 기준)
Pos Value (USDT)
현재 포지션의 시장 가치 (수량 × 현재 가격)
Leverage (Now)
현재 실레버리지 (포지션 가치 / 현재 자산)
DD from ATH (%)
현재 가격 기준, 최근 ATH에서의 하락률(%)
Avg Entry
현재 포지션의 평균 진입 가격
PnL (%)
현재 포지션 기준 미실현 손익률(%)
Max DD (Equity %)
전략 전체 기간 동안 기록된 계좌 기준 최대 손실(MDD, Max Drawdown)
Last Entry Price
가장 최근에 포지션을 추가로 진입한 직후의 평균 진입 가격
Last Entry Lev
위 “Last Entry Price” 시점에서의 실레버리지
Liq Price (Fixed)
위에서 설명한 고정형 추정 청산가
Return from Start (%)
전략 시작 시점(초기 자본) 대비 현재 계좌 자산의 총 수익률(%)
이 테이블을 통해 사용자는:
현재 계좌와 포지션의 상태
리스크 수준
누적 성과
를 직관적으로 파악할 수 있습니다.
6. 시간 필터 및 라벨 옵션
6-1. 전략 동작 기간 설정
전략은 옵션으로 특정 기간에만 전략을 동작시키는 시간 필터를 제공합니다.
“Use Date Range” 옵션을 활성화하면:
시작 시각과 종료 시각을 지정하여
해당 구간에 한해서만 매매가 발생하도록 제한
옵션을 비활성화하면:
전략은 전체 차트 구간에서 자유롭게 동작
6-2. 진입 라벨 위치 설정
사용자는 매수/레버리지 라벨의 위치를 선택할 수 있습니다.
바 아래 (Below Bar)
바 위 (Above Bar)
실제 가격 위치 (At Price)
이를 통해 개인 취향 및 차트 가독성에 맞추어
시각화 방식을 유연하게 조정할 수 있습니다.
7. 활용 대상 및 사용 예시
본 전략은 다음과 같은 목적에 적합합니다.
현물 또는 선물 롱 포지션 기준 장기·스윙 관점 추매 전략 백테스트
“고점 대비 하락률”을 기준으로 한 규칙 기반 운용 아이디어 검증
레버리지 사용 시
계좌 레버리지·청산가·MDD를 동시에 모니터링하고자 하는 경우
특정 자산에 대해
“새로운 고점이 형성될 때마다
일정한 규칙으로 깊은 조정 구간에서만 분할 진입하고자 할 때”
실거래에 그대로 적용하기보다는,
전략 아이디어 검증 및 리스크 프로파일 분석,
자신의 성향에 맞는 파라미터 탐색 용도로 사용하는 것을 권장합니다.
8. 한계 및 유의사항
백테스트 결과는 미래 성과를 보장하지 않습니다.
과거 데이터에 기반한 시뮬레이션일 뿐이며,
실제 시장에서는
유동성
슬리피지
수수료 체계
강제청산 규칙
등 다양한 변수가 존재합니다.
청산가는 단순화된 공식에 따른 추정치입니다.
거래소별 실제 청산 규칙, 유지 증거금, 수수료, 펀딩비 등은
본 전략의 계산과 다를 수 있으며,
청산가 추정 라인은 참고용 지표일 뿐입니다.
레버리지 및 진입 비율 설정에 따라 손실 폭이 매우 커질 수 있습니다.
특히 **“첫 포지션 300% 진입”**과 같이 매우 공격적인 설정은
시장 급락 시 계좌 손실과 청산 리스크를 크게 증가시킬 수 있으므로
신중한 검토가 필요합니다.
실거래 연동 시에는 별도의 리스크 관리가 필수입니다.
개별 손절 기준
포지션 상한선
전체 포트폴리오 내 비중 관리 등
본 전략 외부에서 추가적인 안전장치가 필요합니다.
9. 결론
ATH Drawdown Re-Buy Long Only 전략은 단순한 “저가 매수”를 넘어서,
ATH 기준으로 드로우다운을 구조적으로 활용하고,
첫 포지션에 대한 **특수 규칙(100% / 300%)**을 적용하며,
레버리지·청산가·MDD·수익률을 통합적으로 시각화함으로써,
하락 구간에서의 규칙 기반 롱 포지션 구축과
리스크 모니터링을 동시에 지원하는 전략입니다.
사용자는 본 전략을 통해:
자신의 시장 관점과 리스크 허용 범위에 맞는
드로우다운 구간
진입 비율
레버리지 설정
다양한 시나리오에 대한 백테스트와 분석
을 수행할 수 있습니다.
다시 한 번 강조하지만,
본 전략은 연구·학습·백테스트를 위한 도구이며,
실제 투자 판단과 책임은 전적으로 사용자 본인에게 있습니다.
/ENG Version.
This script is designed to use historical drawdown data and automatically enter positions when a predefined percentage drop from the all-time high occurs, using a predefined percentage of your account equity.
You can use leverage, and default parameter values are provided out of the box (you can freely change them to suit your style).
In addition to the two main entry levels, you can add more entry conditions and custom entry percentages – just ask ChatGPT to modify the script.
For actual/live usage, please turn OFF the KillSwitch function and turn ON the Bar Magnifier feature.
ATH Drawdown Re-Buy Long Only Strategy
1. Strategy Overview
The ATH Drawdown Re-Buy Long Only strategy is an automatic re-buy (Long Only) system that builds long positions step-by-step at specific drawdown levels, based on the asset’s all-time high (ATH) and its subsequent drawdown.
This strategy is designed with the following goals:
Systematic scaled buying and leverage usage during sharp correction periods
Clear, rule-based entry logic using drawdowns from ATH
Real-time visualization of:
Average entry price
Leverage
Estimated liquidation price
Account MDD (Max Drawdown)
Return / performance
This allows traders to intuitively monitor both risk and position status.
※ This strategy is provided for educational, research, and backtesting purposes only.
It does not constitute investment advice and does not guarantee any profits.
2. Core Concepts
2-1. Drawdown from ATH (All-Time High)
On the chart, the strategy always tracks the highest high as the ATH.
Whenever a new high is made, ATH is updated, and based on that ATH the following are calculated:
How many percent the current bar’s Low is below the ATH
How many percent the current bar’s Close is below the ATH
Using these, the strategy executes buys at two predefined drawdown zones:
1st entry zone: When price drops X% from ATH
2nd entry zone: When price drops Y% from ATH
Each zone is allowed to trigger only once per ATH cycle.
When a new ATH is created, the “1st / 2nd entry possible” flags are reset, and new opportunities open up for that ATH leg.
2-2. Special Rule for the First Position (100% / 300%)
A key feature of this strategy is the special rule for the very first position.
When the strategy currently holds no position and is about to open the first long position:
Under normal conditions, it builds the position using 100% of account equity.
However, if at that moment the price has dropped by at least a predefined threshold from ATH (e.g. around –72.5% or more),
→ the strategy will open the first position using 300% of account equity.
This rule works as follows:
Whether the first entry happens at the 1st drawdown zone or at the 2nd drawdown zone,
If the current drawdown from ATH is at or below the threshold (e.g. –72.5% or worse),
→ the strategy interprets this as “a sufficiently deep crash” and opens the initial position with 300% of equity.
If the drawdown is less severe than the threshold,
→ the first entry is capped at 100% of equity.
So the strategy has two modes for the first entry:
Normal market conditions: 100% of equity
Deep drawdown conditions: 300% of equity
This special rule is intended to be aggressive in extremely deep crashes while staying more conservative in normal corrections.
3. Strategy Logic & Execution
3-1. Entry Conditions
The strategy tracks the ATH using the High price.
For each bar, it calculates the drawdown from ATH.
The user defines two drawdown zones, for example:
1st zone: ATH – 50%
2nd zone: ATH – 72.5%
For each zone, the strategy checks:
If no buy has been executed yet for that zone in the current ATH leg, and
If the current bar’s Low touches or falls below that zone’s price level,
→ That bar is considered to have triggered a buy condition.
Order simulation:
The strategy simulates entering a long position at that zone’s price level
(using a limit/market-like approximation for backtesting).
3-2. ATH Reset & Entry Opportunity Reset
When a new High goes above the previous ATH:
The ATH is updated to this new high.
Internal flags that track whether the 1st and 2nd entries have been used are reset.
This means:
Each time the market makes a new ATH,
The strategy once again has a fresh opportunity to execute 1st and 2nd drawdown entries for that new ATH leg.
4. Position Sizing & Leverage
4-1. Position Size Based on Account Equity
The strategy defines current equity as:
Current Equity = Initial Capital + Realized PnL + Unrealized PnL
For each entry zone, the position value is calculated as follows:
The user inputs:
“What % of equity to use at this zone”
The strategy:
Multiplies current equity by that percentage
Then multiplies by the strategy’s leverage factor
Thus:
Position Value = Current Equity × (Zone % / 100) × Leverage
Finally, this position value is divided by the entry price to determine the actual position size in tokens.
4-2. Exception for the First Position (100% / 300%)
For the very first position (when there is no open position),
the strategy does not use the zone % parameters. Instead, it uses fixed ratios:
Default: Enter the first position with 100% of equity.
If the drawdown from ATH at that moment is greater than or equal to a predefined threshold (e.g. –72.5% or more)
→ Enter the first position with 300% of equity.
The position value is computed as:
Position Value = Current Equity × (100% or 300%) × Leverage
Then it is divided by the entry price to obtain the token quantity.
This rule:
Applies regardless of whether the first entry occurs at the 1st zone or 2nd zone.
Embeds the philosophy:
“In very deep crashes, go much larger on the first entry; otherwise, stay more conservative.”
4-3. Tracking Real Leverage
On each bar, the strategy tracks:
The existing position size at the start of the bar
The newly added size (if any) on that bar
When a new entry occurs, it calculates the real leverage at that moment:
Real Leverage = (Position Value / Current Equity)
This is then displayed on the chart as a label, for example:
Lev 2.53x
This makes it easy to see the actual leverage level at each entry point.
5. Visualization & Monitoring
5-1. On-Chart Visual Elements
The strategy plots the following directly on the chart:
ATH Line
The all-time high (based on High) is plotted as an orange line.
Average Entry Price Line
When a position is open, the average entry price of that position is plotted as a yellow line.
Estimated Liquidation Price (Fixed) Line
The strategy detects when the position size changes.
At each size change, it uses the current average entry price and real leverage to compute an approximate liquidation price.
This “fixed liquidation price” is then plotted as a red line on the chart.
If there is no position, or if leverage is 1x or lower, the liquidation line is removed.
Entry Markers & Labels
When 1st/2nd entry conditions are met, the strategy:
Marks the entry point on the chart.
Displays labels such as "Buy XX% @ Price" and "Lev XXx",
showing both entry percentage and real leverage at that time.
The label placement is configurable:
Below Bar
Above Bar
At Price
5-2. Information Table (Top-Right Panel)
In the top-right corner of the chart, the strategy displays a summary table of the current account and position status. It typically includes:
Pos Qty (Token)
Absolute size of the current position (in tokens)
Pos Value (USDT)
Market value of the current position (qty × current price)
Leverage (Now)
Current real leverage (position value / current equity)
DD from ATH (%)
Current drawdown (%) from the latest ATH, based on current price
Avg Entry
Average entry price of the current position
PnL (%)
Unrealized profit/loss (%) of the current position
Max DD (Equity %)
The maximum equity drawdown (MDD) recorded over the entire backtest period
Last Entry Price
Average entry price immediately after the most recent add-on entry
Last Entry Lev
Real leverage at the time of the most recent entry
Liq Price (Fixed)
The fixed estimated liquidation price described above
Return from Start (%)
Total return (%) of equity compared to the initial capital
Through this table, users can quickly grasp:
Current account and position status
Current risk level
Cumulative performance
6. Time Filters & Label Options
6-1. Strategy Date Range Filter
The strategy provides an option to restrict trading to a specific time range.
When “Use Date Range” is enabled:
You can specify start and end timestamps.
The strategy will only execute trades within that range.
When this option is disabled:
The strategy operates over the entire chart history.
6-2. Entry Label Placement
Users can customize where entry/leverage labels are drawn:
Below Bar (Below Bar)
Above Bar (Above Bar)
At the actual price level (At Price)
This allows you to adjust visualization according to personal preference and chart readability.
7. Use Cases & Applications
This strategy is suitable for the following purposes:
Long-term / swing-style re-buy strategies for spot or futures long positions
Testing rule-based strategies that rely on “drawdown from ATH” as a main signal
Monitoring account leverage, liquidation price, and MDD when using leverage
Handling situations where, for a given asset:
“Every time a new ATH is formed,
you want to wait for deep corrections and enter only at specific drawdown zones”
It is generally recommended to use this strategy not as a direct plug-and-play live system, but as a tool for:
Strategy idea validation
Risk profile analysis
Parameter exploration to match your personal risk tolerance and style
8. Limitations & Warnings
Backtest results do not guarantee future performance.
They are based on historical data only.
In live markets, additional factors exist:
Liquidity
Slippage
Fee structures
Exchange-specific liquidation rules
Funding fees, etc.
The liquidation price is only an approximate estimate, derived from a simplified formula.
Actual liquidation rules, maintenance margin requirements, fees, and other details differ by exchange.
The liquidation line should be treated as a reference indicator, not an exact guarantee.
Depending on the configured leverage and entry percentages, losses can be very large.
In particular, extremely aggressive settings such as “first position 300% of equity” can greatly increase the risk of large account drawdowns and liquidation during sharp market crashes.
Use such settings with extreme caution.
For live trading, additional risk management is essential:
Your own stop-loss rules
Maximum position size limits
Portfolio-level exposure controls
And other external safety mechanisms beyond this strategy
9. Conclusion
The ATH Drawdown Re-Buy Long Only strategy goes beyond simple “buy the dip” logic. It:
Systematically utilizes drawdowns from ATH as a structural signal
Applies a special first-position rule (100% / 300%)
Integrates visualization of leverage, liquidation price, MDD, and returns
All of this supports rule-based long position building in drawdown phases and comprehensive risk monitoring.
With this strategy, users can:
Explore different:
Drawdown zones
Entry percentages
Leverage levels
Run various backtests and scenario analyses
Better understand the risk/return profile that fits their own market view and risk tolerance
Once again, this strategy is intended for research, learning, and backtesting only.
All real trading decisions and their consequences are solely the responsibility of the user.

[Bybit BTCUSD.P] 7Years Backtest Results. 2,609% +Non-Repainting📊 I. Strategy Overview: Trust Backed by Numbers
The ADX Sniper v12 strategy has been rigorously tested over 7 years, from November 14, 2018 to November 8, 2025, spanning every major cycle of the Bitcoin
BTCUSD.P futures market. This strategy successfully balances two often-conflicting goals: maximizing profitability while minimizing volatility, all supported by objective performance data.
This strategy has been validated across all Bitcoin (BTCUSD.P) futures market cycles over a 7-year period.
■ Visual Proof: Bar Replay Simulation
The chart above demonstrates actual entry and exit points captured via TradingView's Bar Replay feature. The green rectangle highlights the core profitable trading zone, showing where the strategy successfully captured sustained uptrends. This visual evidence confirms:
Confirmed buy/sell signals with exact execution prices (marked in red and blue)
No repainting or signal distortion after candle close
Consistent performance across multiple market cycles within the highlighted zone
💰 Core Performance Metrics:
Cumulative Return: 2,609.14% (compounded growth over 7 years)
Maximum Drawdown (MDD): 6.999% (preserving over 93% of capital)
Average Profit/Loss Ratio: 8.003 (industry-leading risk-reward efficiency)
Total Trades: 24 (focused exclusively on high-conviction opportunities)
Sortino Ratio: 11.486 (mathematically proving robustness and stability)
✅ This strategy has been validated across all Bitcoin BTCUSD.P futures market cycles over a 7-year period.
📊 I. 전략 개요: 숫자로 입증된 신뢰
ADX Sniper v12 전략은 2018년 11월 14일부터 2025년 11월 8일까지 약 7년간 비트코인 (BTCUSD.P) 선물 시장의 모든 주요 사이클을 거치며 엄격하게 검증되었습니다. 수익성 극대화와 변동성 최소화라는 상충되는 목표를 동시에 달성한 이 전략의 핵심 성과 지표를 객관적 데이터를 통해 확인하실 수 있습니다.
본 전략은 7년간의 모든 비트코인 (BTCUSD.P) 선물 시장 사이클에서 검증되었습니다.
■ 시각적 증명: 바 리플레이 시뮬레이션
위 차트는 TradingView의 바 리플레이 기능으로 포착된 실제 진입 및 청산 시점을 보여줍니다. 녹색 네모는 핵심 수익 구간을 표시하며, 전략이 지속적인 상승 추세를 성공적으로 포착한 영역을 나타냅니다. 본 시각 자료는 다음을 입증합니다:
정확한 체결 가격이 표기된 확정된 매수/매도 신호 (빨강색과 파랑색으로 표시)
캔들 종가 후 신호 왜곡이나 리페인팅 없음
강조 표시된 구간 내 여러 시장 사이클에 걸친 일관된 성과
💰 핵심 성과 지표:
누적 수익률: 2,609.14% (7년간 복리 성장 입증)
최대 낙폭 (MDD): 6.999% (7년간 자본의 93% 이상 보존)
평균 손익비: 8.003 (업계 최고 수준의 위험-보상 효율성)
총 거래 횟수: 24회 (고확신 기회에만 집중)
소르티노 비율: 11.486 (전략의 견고성과 안정성을 수학적으로 입증)
✅ 본 전략은 7년간의 모든 비트코인 (BTCUSD.P) 선물 시장 사이클에서 검증되었습니다.
🛡️ II. Core Philosophy: Cut Losses Short, Let Profits Run
Why MDD Stays Below 7% in a Volatile Market
The crypto futures market typically experiences daily volatility exceeding 10%, with most strategies enduring drawdowns between 30% and 50%. In stark contrast, this strategy has never exceeded a 7% account loss over seven years. This exceptional low MDD is achieved through deliberate design mechanisms, not luck:
🎯 Entry Filtering: The 'ADX Pop-up Filter' is the core component. It enables the strategy to strictly avoid trading when market conditions indicate major reversals or consolidation phases, thereby minimizing exposure to high-risk zones.
🏛️ Capital Preservation Priority: The strategy prioritizes investor psychological stability and capital preservation over pursuing maximum potential returns.
The Power of an 8.003 Profit Factor
The Profit Factor measures the ratio of total profitable trades to total losing trades. It's the most critical metric for assessing risk-adjusted returns.
A Profit Factor of 8.003 means that for every dollar lost, the strategy earns an average of eight dollars. This demonstrates the efficiency of a true trend-following strategy:
Cutting losses quickly (averaging $177,419 USD loss per trade)
Riding winners for maximum extension (averaging $1,419,920 USD profit per trade)
🛡️ II. 핵심 철학: 손실은 빠르게 자르고, 수익은 끝까지
암호화폐 시장에서 MDD <7%의 의미
암호화폐 선물 시장은 일일 변동성이 10%를 초과하는 경우가 빈번하며, 일반적인 전략들은 30~50%의 MDD를 겪습니다. 이와 극명한 대조로, 본 전략은 7년간 단 한 번도 7%를 초과하는 계좌 손실을 기록하지 않았습니다. 이렇게 극도로 낮은 MDD는 운이 아닌 체계적인 메커니즘을 통해 달성되었습니다:
🎯 진입 필터링: 'ADX 팝업 필터'가 핵심 구성 요소로, 시장 상황이 주요 반전이나 횡보를 나타낼 때 거래를 엄격히 회피하여 고위험 구간 노출을 최소화합니다.
🏛️ 자본 보존 우선: 본 전략은 최대 잠재 손실을 감수하기보다 투자자의 심리적 안정성과 자본 보존을 우선시하도록 설계되었습니다.
손익비 8.003의 힘
손익비는 '총 수익 거래'와 '총 손실 거래'의 비율로, 위험 조정 수익을 측정하는 핵심 지표입니다.
8.003이라는 값은 1달러를 잃을 때마다 평균적으로 8달러 이상을 벌어들이는 구조를 의미합니다. 이는 진정한 추세 추종 전략의 최대 효율성을 보여줍니다:
손실은 빠르게 자르고 ($177,419 USD 평균 손실)
수익은 최대한 연장합니다 ($1,419,920 USD 평균 수익)
🎯 III. Strategy Reliability and Structural Edge
The Secret of 24 Trades in 7 Years
Only 24 trades over 7 years signifies that this strategy ignores 99% of market volatility and targets only the 1% of 'most certain buying cycles'. This approach eliminates the drag from excessive trading:
❌ No commission bleed
❌ No slippage erosion
❌ No psychological wear from overtrading
📈 Long-Term Trend Following: The strategy analyzes Bitcoin's long-term price cycles to capture the onset of massive trends while remaining undisturbed by short-term market noise.
Non-Repainting Structure: Alignment of Reality and Simulation
🎬 Non-Repainting Proof Video Available
※↑ "If you wish, I can also show you a video as evidence of the non-repainting throughout the 7 years."
✅ Real-Time Trading Reliability: This strategy is built with a non-repainting structure, generating buy/sell signals only after each candle's closing price is confirmed.
✅ Preventing Data Exaggeration: This design ensures that backtest results do not 'repaint' or distort past performance, guaranteeing high correlation between simulated results and actual live trading environments.
✅ Live Trading Advantage: While simulations use closing prices, live trading may allow entry at more favorable prices before candle close, potentially yielding even better execution than backtest results.
🎯 III. 전략의 신뢰성과 구조적 우위
7년간 24회 거래의 비밀
7년간 단 24회의 거래는 시장 변동성의 99%를 무시하고 오직 1%의 '가장 확실한 매수 사이클'만을 타겟으로 한다는 것을 의미합니다. 이는 과도한 거래로 인한 문제를 근본적으로 제거합니다:
❌ 수수료 소모 없음
❌ 슬리피지 침식 없음
❌ 과도한 트레이딩으로 인한 심리적 소모 없음
📈 장기 추세 추종: 비트코인 가격 역사를 지배하는 장기 사이클 분석을 활용하여, 단기 시장 노이즈에 흔들리지 않고 대규모 추세의 시작점을 포착하는 데 집중합니다.
논-리페인팅 구조: 현실과 시뮬레이션의 일치
🎬 논-리페인팅 증명 영상 제공 가능
※↑ "원하신다면 7년간 리페인팅이 없음을 증명하는 영상도 보여드릴 수 있습니다."
✅ 실시간 거래 신뢰성: 본 전략은 논-리페인팅 구조로 구축되어, 캔들의 종가가 확정된 후에만 매수/매도 신호를 생성합니다.
✅ 데이터 과장 방지: 이러한 설계는 백테스트 결과가 과거 성과를 '리페인팅'하거나 과장하지 않도록 보장하며, 시뮬레이션 결과와 실제 라이브 거래 환경 간의 높은 상관관계를 보장합니다.
✅ 라이브 실행 우위 가능성: 시뮬레이션은 종가 기준이지만, 라이브 운영 시 캔들이 마감되기 전 더 유리한 가격에 진입할 수 있어 시뮬레이션 결과보다 더 나은 실행 성과를 얻을 가능성이 있습니다.
📈 IV. Performance Summary (November 14, 2018 - November 8, 2025)
| Metric | Value || Metric | Value |
|--------|-------|
| Initial Capital | $1,000,000 |
| Net Profit | +$26,091,383.74 |
| Cumulative Return | +2,609.14% |
| Maximum Drawdown | -6.999% |
| Total Trades | 24 |
| Winning Trades | 19 (79.17%) |
| Losing Trades | 5 (20.83%) |
| Avg Winning Trade | +$1,419,920.16 |
| Avg Losing Trade | -$177,419.86 |
| Profit Factor | 8.003 |
| Sortino Ratio | 11.486 |
| Win/Loss Ratio | 8.003 |
⚙️ Default Settings:
Slippage: 0 ticks
Commission: 0.333% (Bybit standard)
📈 IV. 성과 지표 요약 (2018년 11월 14일 ~ 2025년 11월 8일)
|| 지표 | 값 |
|--------|-------|
| 초기 자본 | $1,000,000 |
| 순이익 | +$26,091,383.74 |
| 누적 수익률 | +2,609.14% |
| 최대 낙폭 | -6.999% |
| 총 거래 횟수 | 24 |
| 수익 거래 | 19 (79.17%) |
| 손실 거래 | 5 (20.83%) |
| 평균 수익 거래 | +$1,419,920.16 |
| 평균 손실 거래 | -$177,419.86 |
| 손익비 | 8.003 |
| 소르티노 비율 | 11.486 |
| 평균 손익 비율 | 8.003 |
⚙️ 기본 설정:
슬리피지: 0틱 (기본값)
수수료: 0.333% (Bybit 표준)
👥 V. Who Is This Strategy For?
✅ Long-term Bitcoin investors seeking stable, low-drawdown returns
✅ Traders tired of overtrading who prefer surgical, sniper-style precision entries
✅ Investors seeking psychological stability by avoiding large account swings
✅ Data-driven decision makers who value proven performance over marketing claims
👥 V. 이 전략은 누구를 위한 것인가요?
✅ 안정적이고 낮은 낙폭의 수익을 추구하는 장기 비트코인 투자자
✅ 과도한 매매에 지친 트레이더로 저격수 스타일의 정밀한 진입을 선호하는 분
✅ 큰 계좌 변동을 피하여 심리적 안정성을 추구하는 투자자
✅ 주장보다 검증된 객관적 성과를 중시하는 데이터 기반 의사 결정자
🔒 VI. Access & Disclaimer
🔐 Access Type: Invite-Only (Protected Source Code)
💬 How to Get Access: Send a private message or leave a comment below
⚠️ Important Disclaimer:
Past performance does not guarantee future results. Cryptocurrency and futures trading involve substantial risk of loss. This strategy is provided for educational and informational purposes only. Users should conduct their own research and consult with a financial advisor before making investment decisions. The author is not responsible for any financial losses incurred from using this strategy.
🔒 VI. 접근 방법 및 면책사항
🔐 접근 유형: 초대 전용 (소스코드 보호)
💬 접근 방법: 비공개 메시지 또는 아래 댓글 남기기
⚠️ 중요 면책사항:
과거 성과가 미래 결과를 보장하지 않습니다. 암호화폐 및 선물 거래는 상당한 손실 위험을 수반합니다. 본 전략은 교육 및 정보 제공 목적으로만 제공됩니다. 사용자는 투자 결정을 내리기 전 자체 조사를 수행하고 재무 자문가와 상담해야 합니다. 저자는 본 전략 사용으로 인한 재정적 손실에 대해 책임지지 않습니다.
🏷️ VII. Tags
Bitcoin |Bitcoin | BTCUSD | BTCUSD.P | Bybit | DailyChart | LongTerm | TrendFollowing | ADX | NonRepainting | Strategy | BacktestProven | SevenYears | LowDrawdown | HighProfitFactor | StableReturns | CapitalPreservation | Ichimoku | DMI | SuperTrend | TechnicalAnalysis | Volatility | RiskManagement | AutoTrading | Futures | PerpetualFutures | AlgorithmicTrading | SystematicTrading | DataDriven | InviteOnly | ProtectedScript | SnipperTrading | HighConviction | MDD | SortinoRatio
🏷️ VII. 태그
비트코인 |비트코인 | BTCUSD | BTCUSD.P | 바이비트 | 일봉 | 장기투자 | 추세추종 | ADX | 논리페인팅 | 전략 | 백테스트검증 | 7년검증 | 저낙폭 | 고손익비 | 안정수익 | 자본보존 | 일목균형표 | DMI | 슈퍼트렌드 | 기술적분석 | 변동성 | 위험관리 | 자동매매 | 선물 | 무기한선물 | 알고리즘트레이딩 | 시스템트레이딩 | 데이터기반 | 초대전용 | 보호스크립트 | 저격수트레이딩 | 고확신 | MDD | 소르티노비율
📌 Note: This strategy is designed exclusively for Bybit BTCUSD.P perpetual futures on the 1-day (daily) timeframe. Performance may vary significantly on other symbols or timeframes.
📌 참고: 본 전략은 Bybit BTCUSD.P 무기한 선물 계약의 1일봉(Daily) 타임프레임에 전용으로 설계되었습니다. 다른 심볼이나 타임프레임에서는 성과가 크게 달라질 수 있습니다.

[Bybit BTCUSD.P] 7Years Backtest Results. 2,609% +Non-Repainting
📊 I. Strategy Overview: Trust Backed by Numbers
The ADX Sniper v12 strategy has been rigorously tested over 7 years, from November 14, 2018 to November 8, 2025, spanning every major cycle of the Bitcoin BTCUSD.P futures market. This strategy successfully balances two often-conflicting goals: maximizing profitability while minimizing volatility, all supported by objective performance data.
This strategy has been validated across all Bitcoin (BTCUSD.P) futures market cycles over a 7-year period.
■ Visual Proof: Bar Replay Simulation
The chart above demonstrates actual entry and exit points captured via TradingView's Bar Replay feature. The green rectangle highlights the core profitable trading zone, showing where the strategy successfully captured sustained uptrends. This visual evidence confirms:
1) Confirmed buy/sell signals with exact execution prices (marked in red and blue)
2) No repainting or signal distortion after candle close
3) Consistent performance across multiple market cycles within the highlighted zone
💰 Core Performance Metrics:
Cumulative Return : 2,609.14% (compounded growth over 7 years)
Maximum Drawdown (MDD) : 6.999% (preserving over 93% of capital)
Average Profit/Loss Ratio : 8.003 (industry-leading risk-reward efficiency)
Total Trades : 24 (focused exclusively on high-conviction opportunities)
Sortino Ratio : 11.486 (mathematically proving robustness and stability)
✅ This strategy has been validated across all Bitcoin BTCUSD.P futures market cycles over a 7-year period.
🛡️ II. Core Philosophy: Cut Losses Short, Let Profits Run
Why MDD Stays Below 7% in a Volatile Market
The crypto futures market typically experiences daily volatility exceeding 10%, with most strategies enduring drawdowns between 30% and 50%. In stark contrast, this strategy has never exceeded a 7% account loss over seven years. This exceptional low MDD is achieved through deliberate design mechanisms, not luck:
🎯 Entry Filtering: The 'ADX Pop-up Filter' is the core component. It enables the strategy to strictly avoid trading when market conditions indicate major reversals or consolidation phases, thereby minimizing exposure to high-risk zones.
🏛️ Capital Preservation Priority: The strategy prioritizes investor psychological stability and capital preservation over pursuing maximum potential returns.
The Power of an 8.003 Profit Factor
The Profit Factor measures the ratio of total profitable trades to total losing trades. It's the most critical metric for assessing risk-adjusted returns.
A Profit Factor of 8.003 means that for every dollar lost, the strategy earns an average of eight dollars. This demonstrates the efficiency of a true trend-following strategy:
Cutting losses quickly (averaging $177,419 USD loss per trade)
Riding winners for maximum extension (averaging $1,419,920 USD profit per trade)
🎯 III. Strategy Reliability and Structural Edge
The Secret of 24 Trades in 7 Years
Only 24 trades over 7 years signifies that this strategy ignores 99% of market volatility and targets only the 1% of 'most certain buying cycles'. This approach eliminates the drag from excessive trading:
❌ No commission bleed
❌ No slippage erosion
❌ No psychological wear from overtrading
📈 Long-Term Trend Following: The strategy analyzes Bitcoin's long-term price cycles to capture the onset of massive trends while remaining undisturbed by short-term market noise.
Non-Repainting Structure: Alignment of Reality and Simulation
🎬 Non-Repainting Proof Video Available
※↑ "If you wish, I can also show you a video as evidence of the non-repainting throughout the 7 years."
✅ Real-Time Trading Reliability: This strategy is built with a non-repainting structure, generating buy/sell signals only after each candle's closing price is confirmed.
✅ Preventing Data Exaggeration: This design ensures that backtest results do not 'repaint' or distort past performance, guaranteeing high correlation between simulated results and actual live trading environments.
✅ Live Trading Advantage: While simulations use closing prices, live trading may allow entry at more favorable prices before candle close, potentially yielding even better execution than backtest results.
📈 IV. Performance Summary (November 14, 2018 - November 8, 2025)
|| Metric | Value |
|--------|-------|
| Initial Capital | $1,000,000 |
| Net Profit | +$26,091,383.74 |
| Cumulative Return | +2,609.14% |
| Maximum Drawdown | -6.999% |
| Total Trades | 24 |
| Winning Trades | 19 (79.17%) |
| Losing Trades | 5 (20.83%) |
| Avg Winning Trade | +$1,419,920.16 |
| Avg Losing Trade | -$177,419.86 |
| Profit Factor | 8.003 |
| Sortino Ratio | 11.486 |
| Win/Loss Ratio | 8.003 |
⚙️ Default Settings:
Slippage: 0 ticks
Commission: 0.333% (Bybit standard)
👥 V. Who Is This Strategy For?
✅ Long-term Bitcoin investors seeking stable, low-drawdown returns
✅ Traders tired of overtrading who prefer surgical, sniper-style precision entries
✅ Investors seeking psychological stability by avoiding large account swings
✅ Data-driven decision makers who value proven performance over marketing claims
🔒 VI. Access & Disclaimer
🔐 Access Type: Invite-Only (Protected Source Code)
💬 How to Get Access: Send a private message or leave a comment below
⚠️ Important Disclaimer:
Past performance does not guarantee future results. Cryptocurrency and futures trading involve substantial risk of loss. This strategy is provided for educational and informational purposes only. Users should conduct their own research and consult with a financial advisor before making investment decisions. The author is not responsible for any financial losses incurred from using this strategy.
🏷️ VII. Tags
Bitcoin |Bitcoin | BTCUSD | BTCUSD.P | Bybit | DailyChart | LongTerm | TrendFollowing | ADX | NonRepainting | Strategy | BacktestProven | SevenYears | LowDrawdown | HighProfitFactor | StableReturns | CapitalPreservation | Ichimoku | DMI | SuperTrend | TechnicalAnalysis | Volatility | RiskManagement | AutoTrading | Futures | PerpetualFutures | AlgorithmicTrading | SystematicTrading | DataDriven | InviteOnly | ProtectedScript | SnipperTrading | HighConviction | MDD | SortinoRatio
📌 Note: This strategy is designed exclusively for Bybit BTCUSD.P perpetual futures on the 1-day (daily) timeframe. Performance may vary significantly on other symbols or timeframes.

W%R Pullback+EMA Trend [TS_Indie]🔰 Core Concept of the Strategy
The main idea is “Trend-Following with Momentum Pullback.”
This means trading in the direction of the main trend (defined by EMA) while using Williams %R to identify pullback entries (buying the dip or selling the rally) where momentum returns to the trend direction.
📊 Indicators Used
1. EMA Fast – Defines the short-term trend.
2. EMA Slow – Defines the long-term trend (used as a trend filter).
3. Williams %R
• Overbought zone: above -20
• Oversold zone: below -80
⚙️ Entry Rules
🔹 Buy Setup
1. EMA Fast > EMA Slow → Uptrend condition.
2. Williams %R on the previous candle dropped below -80, and on the current candle, it crosses back above -80 → indicates momentum returning to the upside.
3. Current close is above EMA Fast.
4. Entry Buy at the close of the candle where %R crosses above -80.
🎯 Entry, Stop Loss, and Take Profit
1. Entry : At the candle close where the signal occurs.
2. Stop Loss : At the lowest low between the current and previous candles.
3. Take Profit : Calculated based on entry price and stop loss distance multiplied by the Risk/Reward Ratio.
🔹 Sell Setup
1. EMA Fast < EMA Slow → Downtrend condition.
2. Williams %R on the previous candle went above -20, and on the current candle, it crosses back below -20 → indicates renewed selling momentum.
3. Current price is below EMA Fast.
4. Entry Sell at the close of the candle where %R crosses below -20.
🎯 Entry, Stop Loss, and Take Profit
1. Entry : At the candle close where the signal occurs.
2. Stop Loss : At the highest high between the current and previous candles.
3. Take Profit : Calculated based on entry price and stop loss distance multiplied by the Risk/Reward Ratio.
⚙️ Optional Parameters
• Custom Risk/Reward Ratio for Take Profit.
• Option to add ATR buffer to Stop Loss.
• Adjustable EMA Fast period.
• Adjustable EMA Slow period.
• Adjustable Williams %R period.
• Option to enable Long only / Short only positions.
• Customizable Backtest start and end date.
• Customizable trading session time.
⏰ Alert Function
Alerts display:
• Entry price
• Stop Loss price
• Take Profit price
Guys, try adjusting the parameters yourselves!
I’ve been tweaking the settings for several days and managed to get great results on XAU/USD in the 5-minute timeframe.
I think this strategy is quite interesting and could potentially deliver good results on other instruments as well.
⚠️ Disclaimer
This indicator is designed for educational and research purposes only.
It does not guarantee profits and should not be considered financial advice.
Trading in financial markets involves significant risk, including the potential loss of capital.

Zero Lag Trend Signals (MTF) [Quant Trading] V7Overview
The Zero Lag Trend Signals (MTF) V7 is a comprehensive trend-following strategy that combines Zero Lag Exponential Moving Average (ZLEMA) with volatility-based bands to identify high-probability trade entries and exits. This strategy is designed to reduce lag inherent in traditional moving averages while incorporating dynamic risk management through ATR-based stops and multiple exit mechanisms.
This is a longer term horizon strategy that takes limited trades. It is not a high frequency trading and therefore will also have limited data and not > 100 trades.
How It Works
Core Signal Generation:
The strategy uses a Zero Lag EMA (ZLEMA) calculated by applying an EMA to price data that has been adjusted for lag:
Calculate lag period: floor((length - 1) / 2)
Apply lag correction: src + (src - src )
Calculate ZLEMA: EMA of lag-corrected price
Volatility bands are created using the highest ATR over a lookback period multiplied by a band multiplier. These bands are added to and subtracted from the ZLEMA line to create upper and lower boundaries.
Trend Detection:
The strategy maintains a trend variable that switches between bullish (1) and bearish (-1):
Long Signal: Triggers when price crosses above ZLEMA + volatility band
Short Signal: Triggers when price crosses below ZLEMA - volatility band
Optional ZLEMA Trend Confirmation:
When enabled, this filter requires ZLEMA to show directional momentum before entry:
Bullish Confirmation: ZLEMA must increase for 4 consecutive bars
Bearish Confirmation: ZLEMA must decrease for 4 consecutive bars
This additional filter helps avoid false signals in choppy or ranging markets.
Risk Management Features:
The strategy includes multiple stop-loss and take-profit mechanisms:
Volatility-Based Stops: Default stop-loss is placed at ZLEMA ± volatility band
ATR-Based Stops: Dynamic stop-loss calculated as entry price ± (ATR × multiplier)
ATR Trailing Stop: Ratcheting stop-loss that follows price but never moves against position
Risk-Reward Profit Target: Take-profit level set as a multiple of stop distance
Break-Even Stop: Moves stop to entry price after reaching specified R:R ratio
Trend-Based Exit: Closes position when price crosses EMA in opposite direction
Performance Tracking:
The strategy includes optional features for monitoring and analyzing trades:
Floating Statistics Table: Displays key metrics including win rate, GOA (Gain on Account), net P&L, and max drawdown
Trade Log Labels: Shows entry/exit prices, P&L, bars held, and exit reason for each closed trade
CSV Export Fields: Outputs trade data for external analysis
Default Strategy Settings
Commission & Slippage:
Commission: 0.1% per trade
Slippage: 3 ticks
Initial Capital: $1,000
Position Size: 100% of equity per trade
Main Calculation Parameters:
Length: 70 (range: 70-7000) - Controls ZLEMA calculation period
Band Multiplier: 1.2 - Adjusts width of volatility bands
Entry Conditions (All Disabled by Default):
Use ZLEMA Trend Confirmation: OFF - Requires ZLEMA directional momentum
Re-Enter on Long Trend: OFF - Allows multiple entries during sustained trends
Short Trades:
Allow Short Trades: OFF - Strategy is long-only by default
Performance Settings (All Disabled by Default):
Use Profit Target: OFF
Profit Target Risk-Reward Ratio: 2.0 (when enabled)
Dynamic TP/SL (All Disabled by Default):
Use ATR-Based Stop-Loss & Take-Profit: OFF
ATR Length: 14
Stop-Loss ATR Multiplier: 1.5
Profit Target ATR Multiplier: 2.5
Use ATR Trailing Stop: OFF
Trailing Stop ATR Multiplier: 1.5
Use Break-Even Stop-Loss: OFF
Move SL to Break-Even After RR: 1.5
Use Trend-Based Take Profit: OFF
EMA Exit Length: 9
Trade Data Display (All Disabled by Default):
Show Floating Stats Table: OFF
Show Trade Log Labels: OFF
Enable CSV Export: OFF
Trade Label Vertical Offset: 0.5
Backtesting Date Range:
Start Date: January 1, 2018
End Date: December 31, 2069
Important Usage Notes
Default Configuration: The strategy operates in its most basic form with default settings - using only ZLEMA crossovers with volatility bands and volatility-based stop-losses. All advanced features must be manually enabled.
Stop-Loss Priority: If multiple stop-loss methods are enabled simultaneously, the strategy will use whichever condition is hit first. ATR-based stops override volatility-based stops when enabled.
Long-Only by Default: Short trading is disabled by default. Enable "Allow Short Trades" to trade both directions.
Performance Monitoring: Enable the floating stats table and trade log labels to visualize strategy performance during backtesting.
Exit Mechanisms: The strategy can exit trades through multiple methods: stop-loss hit, take-profit reached, trend reversal, or trailing stop activation. The trade log identifies which exit method was used.
Re-Entry Logic: When "Re-Enter on Long Trend" is enabled with ZLEMA trend confirmation, the strategy can take multiple long positions during extended uptrends as long as all entry conditions remain valid.
Capital Efficiency: Default setting uses 100% of equity per trade. Adjust "default_qty_value" to manage position sizing based on risk tolerance.
Realistic Backtesting: Strategy includes commission (0.1%) and slippage (3 ticks) to provide realistic performance expectations. These values should be adjusted based on your broker and market conditions.
Recommended Use Cases
Trending Markets: Best suited for markets with clear directional moves where trend-following strategies excel
Medium to Long-Term Trading: The default length of 70 makes this strategy more appropriate for swing trading rather than scalping
Risk-Conscious Traders: Multiple stop-loss options allow traders to customize risk management to their comfort level
Backtesting & Optimization: Comprehensive performance tracking features make this strategy ideal for testing different parameter combinations
Limitations & Considerations
Like all trend-following strategies, performance may suffer in choppy or ranging markets
Default 100% position sizing means full capital exposure per trade - consider reducing for conservative risk management
Higher length values (70+) reduce signal frequency but may improve signal quality
Multiple simultaneous risk management features may create conflicting exit signals
Past performance shown in backtests does not guarantee future results
Customization Tips
For more aggressive trading:
Reduce length parameter (minimum 70)
Decrease band multiplier for tighter bands
Enable short trades
Use lower profit target R:R ratios
For more conservative trading:
Increase length parameter
Enable ZLEMA trend confirmation
Use wider ATR stop-loss multipliers
Enable break-even stop-loss
Reduce position size from 100% default
For optimal choppy market performance:
Enable ZLEMA trend confirmation
Increase band multiplier
Use tighter profit targets
Avoid re-entry on trend continuation
Visual Elements
The strategy plots several elements on the chart:
ZLEMA line (color-coded by trend direction)
Upper and lower volatility bands
Long entry markers (green triangles)
Short entry markers (red triangles, when enabled)
Stop-loss levels (when positions are open)
Take-profit levels (when enabled and positions are open)
Trailing stop lines (when enabled and positions are open)
Optional ZLEMA trend markers (triangles at highs/lows)
Optional trade log labels showing complete trade information
Exit Reason Codes (for CSV Export)
When CSV export is enabled, exit reasons are coded as:
0 = Manual/Other
1 = Trailing Stop-Loss
2 = Profit Target
3 = ATR Stop-Loss
4 = Trend Change
Conclusion
Zero Lag Trend Signals V7 provides a robust framework for trend-following with extensive customization options. The strategy balances simplicity in its core logic with sophisticated risk management features, making it suitable for both beginner and advanced traders. By reducing moving average lag while incorporating volatility-based signals, it aims to capture trends earlier while managing risk through multiple configurable exit mechanisms.
The modular design allows traders to start with basic trend-following and progressively add complexity through ZLEMA confirmation, multiple stop-loss methods, and advanced exit strategies. Comprehensive performance tracking and export capabilities make this strategy an excellent tool for systematic testing and optimization.
Note: This strategy is provided for educational and backtesting purposes. All trading involves risk. Past performance does not guarantee future results. Always test thoroughly with paper trading before risking real capital, and adjust position sizing and risk parameters according to your risk tolerance and account size.
================================================================================
TAGS:
================================================================================
trend following, ZLEMA, zero lag, volatility bands, ATR stops, risk management, swing trading, momentum, trend confirmation, backtesting
================================================================================
CATEGORY:
================================================================================
Strategies
================================================================================
CHART SETUP RECOMMENDATIONS:
================================================================================
For optimal visualization when publishing:
Use a clean chart with no other indicators overlaid
Select a timeframe that shows multiple trade signals (4H or Daily recommended)
Choose a trending asset (crypto, forex major pairs, or trending stocks work well)
Show at least 6-12 months of data to demonstrate strategy across different market conditions
Enable the floating stats table to display key performance metrics
Ensure all indicator lines (ZLEMA, bands, stops) are clearly visible
Use the default chart type (candlesticks) - avoid Heikin Ashi, Renko, etc.
Make sure symbol information and timeframe are clearly visible
================================================================================
COMPLIANCE NOTES:
================================================================================
✅ Open-source publication with complete code visibility
✅ English-only title and description
✅ Detailed explanation of methodology and calculations
✅ Realistic commission (0.1%) and slippage (3 ticks) included
✅ All default parameters clearly documented
✅ Performance limitations and risks disclosed
✅ No unrealistic claims about performance
✅ No guaranteed results promised
✅ Appropriate for public library (original trend-following implementation with ZLEMA)
✅ Educational disclaimers included
✅ All features explained in detail
================================================================================

Universal Regime Alpha Thermocline StrategyCurrents settings adapted for BTCUSD Daily timeframe
This description is written to comply with TradingView House Rules and Script Publishing Rules. It is self contained, in English first, free of advertising, and explains originality, method, use, defaults, and limitations. No external links are included. Nothing here is investment advice.
0. Publication mode and rationale
This script is published as Protected . Anyone can add and test it from the Public Library, yet the source code is not visible.
Why Protected
The engine combines three independent lenses into one regime score and then uses an adaptive centering layer and a thermo risk unit that share a common AAR measure. The exact mapping and interactions are the result of original research and extensive validation. Keeping the implementation protected preserves that work and avoids low effort clones that would fragment feedback and confuse users.
Protection supports a single maintained build for users. It reduces accidental misuse of internal functions outside their intended context which might lead to misleading results.
1. What the strategy does in one paragraph
Universal Regime Alpha Thermocline builds a single number between zero and one that answers a practical question for any market and timeframe. How aligned is current price action with a persistent directional regime right now. To answer this the script fuses three views of the tape. Directional entropy of up versus down closes to measure unanimity.
Convexity drift that rewards true geometric compounding and penalizes drag that comes from chop where arithmetic pace is high but growth is poor.
Tail imbalance that counts decisive bursts in one direction relative to typical bar amplitude. The three channels are blended, optionally confirmed by a higher timeframe, and then adaptively centered to remove local bias. Entries fire when the score clears an entry gate. Exits occur when the score mean reverts below an exit gate or when thermo stops remove risk. Position size can scale with the certainty of the signal.
2. Why it is original and useful
It mixes orthogonal evidence instead of leaning on a single family of tools. Many regime filters depend on moving averages or volatility compression. Here we add an information view from entropy, a growth view from geometric drift, and a structural view from tail imbalance.
The drift channel separates growth from speed. Arithmetic pace can look strong in whipsaw, yet geometric growth stays weak. The engine measures both and subtracts drag so that only sequences with compounding quality rise.
Tail counting is anchored to AAR which is the average absolute return of bars in the window. This makes the threshold self scaling and portable across symbols and timeframes without hand tuned constants.
Adaptive centering prevents the score from living above or below neutral for long stretches on assets with strong skew. It recovers neutrality while still allowing persistent regimes to dominate once evidence accumulates.
The same AAR unit used in the signal also sets stop distance and trail distance. Signal and risk speak the same language which makes the method portable and easier to reason about.
3. Plain language overview of the math
Log returns . The base series is r equal to the natural log of close divided by the previous close. Log return allows clean aggregation and makes growth comparisons natural.
Directional entropy . Inside the lookback we compute the proportion p of bars where r is positive. Binary entropy of p is high when the mix of up and down closes is balanced and low when one direction dominates. Intensity is one minus entropy. Directional sign is two times p minus one. The trend channel is zero point five plus one half times sign times intensity. It lives between zero and one and grows stronger as unanimity increases.
Convexity drift with drag . Arithmetic mean of r measures pace. Geometric mean of the price ratio over the window measures compounding. Drag is the positive part of arithmetic minus geometric. Drift raw equals geometric minus drag multiplier times drag. We then map drift through an arctangent normalizer scaled by AAR and a nonlinearity parameter so the result is stable and remains between zero and one.
Tail imbalance . AAR equals the average of the absolute value of r in the window. We count up tails where r is greater than aar_mult times AAR and down tails where r is less than minus aar_mult times AAR. The imbalance is their difference over their total, mapped to zero to one. This detects directional impulse flow.
Fusion and centering . A weighted average of the three channels yields the raw score. If a higher timeframe is requested, the same function is executed on that timeframe with lookahead off and blended with a weight. Finally we subtract a fraction of the rolling mean of the score to recover neutrality. The result is clipped to the zero to one band.
4. Entries, exits, and position sizing
Enter long when score is strictly greater than the entry gate. Enter short when score is strictly less than one minus the entry gate unless direction is restricted in inputs.
Exit a long when score falls below the exit gate. Exit a short when score rises above one minus the exit gate.
Thermo stops are expressed in AAR units. A long uses the maximum of an initial stop sized by the entry price and AAR and a trail stop that references the running high since entry with a separate multiple. Shorts mirror this with the running low. If the trail is disabled the initial stop is active.
Cooldown is a simple bar counter that begins when the position returns to flat. It prevents immediate re entry in churn.
Dynamic position size is optional. When enabled the order percent of equity scales between a floor and a cap as the score rises above the gate for longs or below the symmetric gate for shorts.
5. Inputs quick guide with recommended ranges
Every input has a tooltip in the script. The same guidance appears here for fast reading.
Core window . Shared lookback for entropy, drift, and tails. Start near 80 on daily charts. Try 60 to 120 on intraday and 80 to 200 for swing.
Entry threshold . Typical range 0.55 to 0.65 for trend following. Faster entries 0.50 to 0.55.
Exit threshold . Typical range 0.35 to 0.50. Lower holds longer yet gives back more.
Weight directional entropy . Starting value 0.40. Raise on markets with clean persistence.
Weight convexity drift . Starting value 0.40. Raise when compounding quality is critical.
Weight tail imbalance . Starting value 0.20. Raise on breakout prone markets.
Tail threshold vs AAR . Typical range 1.0 to 1.5 to count decisive bursts.
Drag penalty . Typical range 0.25 to 0.75. Higher punishes chop more.
Nonlinearity scale . Typical range 0.8 to 2.0. Larger compresses extremes.
AAR floor in percent . Typical range 0.0005 to 0.002 for liquid instruments. This stabilizes the math during quiet regimes.
Adaptive centering . Keep on for most symbols. Center strength 0.40 to 0.70.
Confirm timeframe optional . Leave empty to disable. If used, try a multiple between three and five of the chart timeframe with a blend weight near 0.20.
Dynamic position size . Enable if you want size to reflect certainty. Floor and cap define the percent of equity band. A practical band for many accounts is 0.5 to 2.
Cooldown bars after exit . Start at 3 on daily or slightly higher on shorter charts.
Thermo stop multiple . Start between 1.5 and 3.0 on daily. Adjust to your tolerance and symbol behavior.
Thermo trailing stop and Trail multiple . Trail on locks gains earlier. A trail multiple near 1.0 to 2.0 is common. You can keep trail off and let the exit gate handle exits.
Background heat opacity . Cosmetic. Set to taste. Zero disables it.
6. Properties used on the published chart
The example publication uses BTCUSD on the daily timeframe. The following Properties and inputs are used so everyone can reproduce the same results.
Initial capital 100000
Base currency USD
Order size 2 percent of equity coming from our risk management inputs.
Pyramiding 0
Commission 0.05 percent
Slippage 10 ticks in the publication for clarity. Users should introduce slippage in their own research.
Recalculate after order is filled off. On every tick off.
Using bar magnifier on. On bar close on.
Risk inputs on the published chart. Dynamic position size on. Size floor percent 2. Size cap percent 2. Cooldown bars after exit 3. Thermo stop multiple 2.5. Thermo trailing stop off. Trail multiple 1.
7. Visual elements and alerts
The score is painted as a subtle dot rail near the bottom. A background heat map runs from red to green to convey regime strength at a glance. A compact HUD at the top right shows current score, the three component channels, the active AAR, and the remaining cooldown. Four alerts are included. Long Setup and Short Setup on entry gates. Exit Long by Score and Exit Short by Score on exit gates. You can disable trading and use alerts only if you want the score as a risk switch inside a discretionary plan.
8. How to reproduce the example
Open a BTCUSD daily chart with regular candles.
Add the strategy and load the defaults that match the values above.
Set Properties as listed in section 6.(they are set by default) Confirm that bar magnifier is on and process on bar close is on.
Run the Strategy Tester. Confirm that the trade count is reasonable for the sample. If the count is too low, slightly lower the entry threshold or extend history. If the count is excessively high, raise the threshold or add a small cooldown.
9. Practical tuning recipes
Trend following focus . Raise the entry threshold toward 0.60. Raise the trend weight to 0.50 and reduce tail weight to 0.15. Keep drift near 0.35 to retain the growth filter. Consider leaving the trail off and let the exit threshold manage positions.
Breakout focus . Keep entry near 0.55. Raise tail weight to 0.35. Keep aar_mult near 1.3 so only decisive bursts count. A modest cooldown near 5 can reduce immediate false flips after the first burst bar.
Chop defense . Raise drag multiplier to 0.70. Raise exit threshold toward 0.48 to recycle capital earlier. Consider a higher cooldown, for example 8 to 12 on intraday.
Higher timeframe blend . On a daily chart try a weekly confirm with a blend near 0.20. On a five minute chart try a fifteen minute confirm. This moderates transitions.
Sizing discipline . If you want constant position size, set floor equal to cap. If you want certainty scaling, set a band like 0.5 to 2 and monitor drawdown behavior before widening it.
10. Strengths and limitations
Strengths
Self scaling unit through AAR makes the tool portable across markets and timeframes.
Blends evidence that target different failure modes. Unanimity, growth quality, and impulse flow rarely agree by chance which raises confidence when they align.
Adaptive centering reduces structural bias at the score level which helps during regime flips.
Limitations
In very quiet regimes AAR becomes small even with a floor. If your symbol is thin or gap prone, raise the floor a little to keep stops and drift mapping stable.
Adaptive centering can delay early breakout acceptance. If you miss starts, lower center strength or temporarily disable centering while you evaluate.
Tail counting uses a fixed multiple of AAR. If a market alternates between very calm and very violent weeks, a single aar_mult may not capture both extremes. Sweep this parameter in research.
The engine reacts to realized structure. It does not anticipate scheduled news or liquidity shocks. Use event awareness if you trade around releases.
11. Realism and responsible publication
No promises or projections of performance are made. Past results never guarantee future outcomes.
Commission is set to 0.05 percent per round which is realistic for many crypto venues. Adjust to your own broker or exchange.
Slippage is set at 10 in the publication . Introduce slippage in your own tests or use a percent model.
Position size should respect sustainable risk envelopes. Risking more than five to ten percent per trade is rarely viable. The example uses a fixed two percent position size.
Security calls use lookahead off. Standard candles only. Non standard chart types like Heikin Ashi or Renko are not supported for strategies that submit orders.
12. Suggested research workflow
Begin with the balanced defaults. Confirm that the trade count is sensible for your timeframe and symbol. As a rough guide, aim for at least one hundred trades across a wide sample for statistical comfort. If your timeframe cannot produce that count, complement with multiple symbols or run longer history.
Sweep entry and exit thresholds on a small grid and observe stability. Stability across windows matters more than the single best value.
Try one higher timeframe blend with a modest weight. Large weights can drown the signal.
Vary aar_mult and drag_mult together. This tunes the aggression of breakouts versus defense in chop.
Evaluate whether dynamic size improves risk adjusted results for your style. If not, set floor equal to cap for constancy.
Walk forward through disjoint segments and inspect results by regime. Bootstrapping or segmented evaluation can reveal sensitivity to specific periods.
13. How to read the HUD and heat map
The HUD presents a compact view. Score is the current fused value. Trend is the directional entropy channel. Drift is the compounding quality channel. Tail is the burst flow channel. AAR is the current unit that scales stops and the drift map. CD is the cooldown counter. The background heat is a visual aid only. It can be disabled in inputs. Green zones near the upper band show alignment among the channels. Muted colors near the mid band show uncertainty.
14. Frequently asked questions
Can I use this as a pure indicator . Yes. Disable entries by restricting direction to one side you will not trade and use the alerts as a regime switch.
Will it work on intraday charts . Yes. The AAR unit scales with bar size. You will likely reduce the core window and increase cooldown slightly.
Should I enable the adaptive trail . If you wish to lock gains sooner and accept more exits, enable it. If you prefer to let the exit gate do the heavy lifting, keep it off.
Why do I sometimes see a green background without a position . Heat expresses the score. A position also depends on threshold comparisons, direction mode, and cooldown.
Why is Order size set to one hundred percent if dynamic size is on . The script passes an explicit quantity percent on each entry. That explicit quantity overrides the property. The property is kept at one hundred percent to avoid confusion when users later disable dynamic sizing.
Can I combine this with other tools on my chart . You can, yet for publication the chart is kept clean so users and moderators can see the output clearly. In your private workspace feel free to add other context.
15. Concepts glossary
AAR . Average absolute return across the lookback. Serves as a unit for tails, drift scaling, and stops.
Directional entropy . A measure of uncertainty of up versus down closes. Low entropy paired with a directional sign signals unanimity.
Geometric mean growth . Rate that preserves the effect of compounding over many bars.
Drag . The positive difference between arithmetic pace and geometric growth. Larger drag often signals churn that looks active but fails to compound.
Thermo stops . Stops expressed in the same AAR unit as the signal. They adapt with volatility and keep risk and signal on a common scale.
Adaptive centering . A bias correction that recenters the fused score around neutral so the meter does not drift due to persistent skew.
16. Educational notice and risk statement
Markets involve risk. This publication is for education and research. It does not provide financial advice and it is not a recommendation to buy or sell any instrument. Use realistic costs. Validate ideas with out of sample testing and with conservative position sizing. Past performance never guarantees future results.
17. Final notes for readers and moderators
The goal of this strategy is clarity and portability. Clarity comes from a single score that reflects three independent features of the tape. Portability comes from self scaling units that respect structure across assets and timeframes. The publication keeps the chart clean, explains the math plainly, lists defaults and Properties used, and includes warnings where care is required. The code is protected so the implementation remains consistent for the community while the description remains complete enough for users to understand its purpose and for moderators to evaluate originality and usefulness. If you explore variants, keep them self contained, explain exactly what they contribute, publish in English first, and treat others with respect in the comments.
Load the strategy on BTCUSD daily with the defaults listed above and study how the score transitions across regimes. Then adjust one lever at a time. Observe how the trend channel, the drift channel, and the tail channel interact during starts, pauses, and reversals. Use the alerts as a risk switch inside your own process or let the built in entries and exits run if you prefer an automated study. The intent is not to promise outcomes. The intent is to give you a robust meter for regime strength that travels well across markets and helps you structure decisions with more confidence.
Thank you for your time to read all of this

Signalgo Strategy ISignalgo Strategy I: Technical Overview
Signalgo Strategy I is a systematically engineered TradingView strategy script designed to automate, test, and manage trend-following trades using multi-timeframe price/volume logic, volatility-based targets, and multi-layered exit management. This summary covers its operational structure, user inputs, entry and exit methodology, unique technical features, and practical application.
Core Logic and Workflow
Multi-Timeframe Data Synthesis
User-Defined Timeframe: The user chooses a timeframe (e.g., 1H, 4H, 1D, etc.), on which all strategy signals are based.
Cross-Timeframe Inputs: The strategy imports closing price, volume, and Average True Range (ATR) for the selected interval, independently from the chart’s native timeframe, enabling robust multi-timeframe analysis.
Price Change & Volume Ratio: It calculates the percent change of price per bar and computes a volume ratio by comparing current volume to its 20-bar moving average—enabling detection of true “event” moves vs. normal market noise.
Hype Filtering
Anti-Hype Mechanism: An entry is automatically filtered out if abnormal high volume occurs without corresponding price movement, commonly observed during manipulation or announcement periods. This helps isolate genuine market-driven momentum.
User Inputs
Select Timeframe: Choose which interval drives signal generation.
Backtest Start Date: Specify from which date historical signals are included in the strategy (for precise backtests).
Take-Profit/Stop-Loss Configuration: Internally, risk levels are set as multiples of ATR and allow for three discrete profit targets.
Entry Logic
Trade Signal Criteria:
Price change magnitude in the current bar must exceed a fixed sensitivity threshold.
Volume for the bar must be significantly elevated compared to average, indicating meaningful participation.
Anti-hype check must not be triggered.
Bullish/Bearish Determination: If all conditions are met and price change direction is positive, a long signal triggers. If negative, a short signal triggers.
Signal Debouncing: Ensures a signal triggers only when a new condition emerges, avoiding duplicate entries on flat or choppy bars.
State Management: The script tracks whether an active long or short is open to avoid overlapping entries and to facilitate clean reversals.
Exit Strategy
Take-Profits: Three distinct profit targets (TP1, TP2, TP3) are calculated as fixed multiples of the ATR-based stop loss, adapting dynamically to volatility.
Reversals: If a buy signal appears while a short is open (or vice versa), the existing trade is closed and reversed in a single step.
Time-Based Exit: If, 49 bars after entry, the trade is in-profit but hasn’t reached TP1, it exits to avoid stagnation risk.
Adverse Move Exit: The position is force-closed if it suffers a 10% reversal from entry, acting as a catastrophic stop.
Visual Feedback: Each TP/SL/exit is plotted as a clear, color-coded line on the chart; no hidden logic is used.
Alerts: Built-in TradingView alert conditions allow automated notification for both entries and strategic exits.
Distinguishing Features vs. Traditional MA Strategies
Event-Based, Not Just Slope-Based: While classic moving average strategies enter trades on MA crossovers or slope changes, Signalgo Strategy I demands high-magnitude price and volume confirmation on the chosen timeframe.
Volume Filtering: Very few MA strategies independently filter for meaningful volume spikes.
Real Market Event Focus: The anti-hype filter differentiates organic market trends from manipulated “high-volume, no-move” sessions.
Three-Layer Exit Logic: Instead of a single trailing stop or fixed RR, this script manages three profit targets, time-based closures, and hard adverse thresholds.
Multi-Timeframe, Not Chart-Dependent: The “main” analytical interval can be set independently from the current chart, allowing for in-depth cross-timeframe backtests and system runs.
Reversal Handling: Automatic handling of signal reversals closes and flips positions precisely, reducing slippage and manual error.
Persistent State Tracking: Maintains variables tracking entry price, trade status, and target/stop levels independently of chart context.
Trading Application
Strategy Sandbox: Designed for robust backtesting, allowing users to simulate performance across historical data for any major asset or interval.
Active Risk Management: Trades are consistently managed for both fixed interval “stall” and significant loss, not just via trailing stops or fixed-day closes.
Alert Driven: Can power algorithmic trading bots or notify discretionary traders the moment a qualifying market event occurs.

Enhanced Ichimoku Cloud Strategy V1 [Quant Trading]Overview
This strategy combines the powerful Ichimoku Kinko Hyo system with a 171-period Exponential Moving Average (EMA) filter to create a robust trend-following approach. The strategy is designed for traders seeking to capitalize on strong momentum moves while using the Ichimoku cloud structure to identify optimal entry and exit points.
This is a patient, low-frequency trading system that prioritizes quality over quantity. In backtesting on Solana, the strategy achieved impressive results with approximately 3600% profit over just 29 trades, demonstrating its effectiveness at capturing major trend movements rather than attempting to profit from every market fluctuation. The extended parameters and strict entry criteria are specifically optimized for Solana's price action characteristics, making it well-suited for traders who prefer fewer, higher-conviction positions over high-frequency trading approaches.
What Makes This Strategy Original
This implementation enhances the traditional Ichimoku system by:
Custom Ichimoku Parameters: Uses non-standard periods (Conversion: 7, Base: 211, Lagging Span 2: 120, Displacement: 41) optimized for different market conditions
EMA Confirmation Filter: Incorporates a 171-period EMA as an additional trend confirmation layer
State Memory System: Implements a sophisticated memory system to track buy/sell states and prevent false signals
Dual Trade Modes: Offers both traditional Ichimoku signals ("Ichi") and cloud-based signals ("Cloud")
Breakout Confirmation: Requires price to break above the 25-period high for long entries
How It Works
Core Components
Ichimoku Elements:
-Conversion Line (Tenkan-sen): 7-period Donchian midpoint
-Base Line (Kijun-sen): 211-period Donchian midpoint
-Span A (Senkou Span A): Average of Conversion and Base lines, plotted 41 periods ahead
-Span B (Senkou Span B): 120-period Donchian midpoint, plotted 41 periods ahead
-Lagging Span (Chikou Span): Current close plotted 41 periods back
EMA Filter: 171-period EMA acts as a long-term trend filter
Entry Logic (Ichi Mode - Default)
A long position is triggered when ALL conditions are met:
Cloud Bullish: Span A > Span B (41 periods ago)
Breakout Confirmation: Current close > 25-period high
Ichimoku Bullish: Conversion Line > Base Line
Trend Alignment: Current close > 171-period EMA
State Memory: No previous buy signal is still active
Exit Logic
Positions are closed when:
Ichimoku Bearish: Conversion Line < Base Line
Alternative Cloud Mode
When "Cloud" mode is selected, the strategy uses:
Entry: Span A crosses above Span B with additional cloud and EMA confirmations
Exit: Span A crosses below Span B with cloud and EMA confirmations
Default Settings Explained
Strategy Properties
Initial Capital: $1,000 (realistic for average traders)
Position Size: 100% of equity (appropriate for backtesting single-asset strategies)
Commission: 0.1% (realistic for most brokers)
Slippage: 3 ticks (accounts for realistic execution costs)
Date Range: January 1, 2018 to December 31, 2069
Key Parameters
Conversion Periods: 7 (faster than traditional 9, more responsive to price changes)
Base Periods: 211 (much longer than traditional 26, provides stronger trend confirmation)
Lagging Span 2 Periods: 120 (custom period for stronger support/resistance levels)
Displacement: 41 (projects cloud further into future than standard 26)
EMA Period: 171 (long-term trend filter, approximately 8.5 months of daily data)
How to Use This Strategy
Best Market Conditions
Trending Markets: Works best in clearly trending markets where the cloud provides strong directional bias
Medium to Long-term Timeframes: Optimized for daily charts and higher timeframes
Volatile Assets: The breakout confirmation helps filter out weak signals in choppy markets
Risk Management
The strategy uses 100% equity allocation, suitable for backtesting single strategies
Consider reducing position size when implementing with real capital
Monitor the 25-period high breakout requirement as it may delay entries in fast-moving markets
Visual Elements
Green/Red Cloud: Shows bullish/bearish cloud conditions
Yellow Line: Conversion Line (Tenkan-sen)
Blue Line: Base Line (Kijun-sen)
Orange Line: 171-period EMA trend filter
Gray Line: Lagging Span (Chikou Span)
Important Considerations
Limitations
Lagging Nature: Like all Ichimoku strategies, signals may lag significant price moves
Whipsaw Risk: Extended periods of consolidation may generate false signals
Parameter Sensitivity: Custom parameters may not work equally well across all market conditions
Backtesting Notes
Results are based on historical data and past performance does not guarantee future results
The strategy includes realistic slippage and commission costs
Default settings are optimized for backtesting and may need adjustment for live trading
Risk Disclaimer
This strategy is for educational purposes only and should not be considered financial advice. Always conduct your own analysis and risk management before implementing any trading strategy. The unique parameter combinations used may not be suitable for all market conditions or trading styles.
Customization Options
Trade Mode: Switch between "Ichi" and "Cloud" signal generation
Short Trading: Option to enable short positions (disabled by default)
Date Range: Customize backtesting period
All Ichimoku Parameters: Fully customizable for different market conditions
This enhanced Ichimoku implementation provides a structured approach to trend following while maintaining the flexibility to adapt to different trading styles and market conditions.

Dskyz (DAFE) Aurora Divergence – Quant Master Dskyz (DAFE) Aurora Divergence – Quant Master
Introducing the Dskyz (DAFE) Aurora Divergence – Quant Master , a strategy that’s your secret weapon for mastering futures markets like MNQ, NQ, MES, and ES. Born from the legendary Aurora Divergence indicator, this fully automated system transforms raw divergence signals into a quant-grade trading machine, blending precision, risk management, and cyberpunk DAFE visuals that make your charts glow like a neon skyline. Crafted with care and driven by community passion, this strategy stands out in a sea of generic scripts, offering traders a unique edge to outsmart institutional traps and navigate volatile markets.
The Aurora Divergence indicator was a cult favorite for spotting price-OBV divergences with its aqua and fuchsia orbs, but traders craved a system to act on those signals with discipline and automation. This strategy delivers, layering advanced filters (z-score, ATR, multi-timeframe, session), dynamic risk controls (kill switches, adaptive stops/TPs), and a real-time dashboard to turn insights into profits. Whether you’re a newbie dipping into futures or a pro hunting reversals, this strat’s got your back with a beginner guide, alerts, and visuals that make trading feel like a sci-fi mission. Let’s dive into every detail and see why this original DAFE creation is a must-have.
Why Traders Need This Strategy
Futures markets are a battlefield—fast-paced, volatile, and riddled with institutional games that can wipe out undisciplined traders. From the April 28, 2025 NQ 1k-point drop to sneaky ES slippage, the stakes are high. Meanwhile, platforms are flooded with unoriginal, low-effort scripts that promise the moon but deliver noise. The Aurora Divergence – Quant Master rises above, offering:
Unmatched Originality: A bespoke system built from the ground up, with custom divergence logic, DAFE visuals, and quant filters that set it apart from copycat clutter.
Automation with Precision: Executes trades on divergence signals, eliminating emotional slip-ups and ensuring consistency, even in chaotic sessions.
Quant-Grade Filters: Z-score, ATR, multi-timeframe, and session checks filter out noise, targeting high-probability reversals.
Robust Risk Management: Daily loss and rolling drawdown kill switches, plus ATR-based stops/TPs, protect your capital like a fortress.
Stunning DAFE Visuals: Aqua/fuchsia orbs, aurora bands, and a glowing dashboard make signals intuitive and charts a work of art.
Community-Driven: Evolved from trader feedback, this strat’s a labor of love, not a recycled knockoff.
Traders need this because it’s a complete, original system that blends accessibility, sophistication, and style. It’s your edge to trade smarter, not harder, in a market full of traps and imitators.
1. Divergence Detection (Core Signal Logic)
The strategy’s core is its ability to detect bullish and bearish divergences between price and On-Balance Volume (OBV), pinpointing reversals with surgical accuracy.
How It Works:
Price Slope: Uses linear regression over a lookback (default: 9 bars) to measure price momentum (priceSlope).
OBV Slope: OBV tracks volume flow (+volume if price rises, -volume if falls), with its slope calculated similarly (obvSlope).
Bullish Divergence: Price slope negative (falling), OBV slope positive (rising), and price above 50-bar SMA (trend_ma).
Bearish Divergence: Price slope positive (rising), OBV slope negative (falling), and price below 50-bar SMA.
Smoothing: Requires two consecutive divergence bars (bullDiv2, bearDiv2) to confirm signals, reducing false positives.
Strength: Divergence intensity (divStrength = |priceSlope * obvSlope| * sensitivity) is normalized (0–1, divStrengthNorm) for visuals.
Why It’s Brilliant:
- Divergences catch hidden momentum shifts, often exploited by institutions, giving you an edge on reversals.
- The 50-bar SMA filter aligns signals with the broader trend, avoiding choppy markets.
- Adjustable lookback (min: 3) and sensitivity (default: 1.0) let you tune for different instruments or timeframes.
2. Filters for Precision
Four advanced filters ensure signals are high-probability and market-aligned, cutting through the noise of volatile futures.
Z-Score Filter:
Logic: Calculates z-score ((close - SMA) / stdev) over a lookback (default: 50 bars). Blocks entries if |z-score| > threshold (default: 1.5) unless disabled (useZFilter = false).
Impact: Avoids trades during extreme price moves (e.g., blow-off tops), keeping you in statistically safe zones.
ATR Percentile Volatility Filter:
Logic: Tracks 14-bar ATR in a 100-bar window (default). Requires current ATR > 80th percentile (percATR) to trade (tradeOk).
Impact: Ensures sufficient volatility for meaningful moves, filtering out low-volume chop.
Multi-Timeframe (HTF) Trend Filter:
Logic: Uses a 50-bar SMA on a higher timeframe (default: 60min). Longs require price > HTF MA (bullTrendOK), shorts < HTF MA (bearTrendOK).
Impact: Aligns trades with the bigger trend, reducing counter-trend losses.
US Session Filter:
Logic: Restricts trading to 9:30am–4:00pm ET (default: enabled, useSession = true) using America/New_York timezone.
Impact: Focuses on high-liquidity hours, avoiding overnight spreads and erratic moves.
Evolution:
- These filters create a robust signal pipeline, ensuring trades are timed for optimal conditions.
- Customizable inputs (e.g., zThreshold, atrPercentile) let traders adapt to their style without compromising quality.
3. Risk Management
The strategy’s risk controls are a masterclass in balancing aggression and safety, protecting capital in volatile markets.
Daily Loss Kill Switch:
Logic: Tracks daily loss (dayStartEquity - strategy.equity). Halts trading if loss ≥ $300 (default) and enabled (killSwitch = true, killSwitchActive).
Impact: Caps daily downside, crucial during events like April 27, 2025 ES slippage.
Rolling Drawdown Kill Switch:
Logic: Monitors drawdown (rollingPeak - strategy.equity) over 100 bars (default). Stops trading if > $1000 (rollingKill).
Impact: Prevents prolonged losing streaks, preserving capital for better setups.
Dynamic Stop-Loss and Take-Profit:
Logic: Stops = entry ± ATR * multiplier (default: 1.0x, stopDist). TPs = entry ± ATR * 1.5x (profitDist). Longs: stop below, TP above; shorts: vice versa.
Impact: Adapts to volatility, keeping stops tight but realistic, with TPs targeting 1.5:1 reward/risk.
Max Bars in Trade:
Logic: Closes trades after 8 bars (default) if not already exited.
Impact: Frees capital from stagnant trades, maintaining efficiency.
Kill Switch Buffer Dashboard:
Logic: Shows smallest buffer ($300 - daily loss or $1000 - rolling DD). Displays 0 (red) if kill switch active, else buffer (green).
Impact: Real-time risk visibility, letting traders adjust dynamically.
Why It’s Brilliant:
- Kill switches and ATR-based exits create a safety net, rare in generic scripts.
- Customizable risk inputs (maxDailyLoss, dynamicStopMult) suit different account sizes.
- Buffer metric empowers disciplined trading, a DAFE signature.
4. Trade Entry and Exit Logic
The entry/exit rules are precise, filtered, and adaptive, ensuring trades are deliberate and profitable.
Entry Conditions:
Long Entry: bullDiv2, cooldown passed (canSignal), ATR filter passed (tradeOk), in US session (inSession), no kill switches (not killSwitchActive, not rollingKill), z-score OK (zOk), HTF trend bullish (bullTrendOK), no existing long (lastDirection != 1, position_size <= 0). Closes shorts first.
Short Entry: Same, but for bearDiv2, bearTrendOK, no long (lastDirection != -1, position_size >= 0). Closes longs first.
Adaptive Cooldown: Default 2 bars (cooldownBars). Doubles (up to 10) after a losing trade, resets after wins (dynamicCooldown).
Exit Conditions:
Stop-Loss/Take-Profit: Set per trade (ATR-based). Exits on stop/TP hits.
Other Exits: Closes if maxBarsInTrade reached, ATR filter fails, or kill switch activates.
Position Management: Ensures no conflicting positions, closing opposites before new entries.
Built To Be Reliable and Consistent:
- Multi-filtered entries minimize false signals, a stark contrast to basic scripts.
- Adaptive cooldown prevents overtrading, especially after losses.
- Clean position handling ensures smooth execution, even in fast markets.
5. DAFE Visuals
The visuals are a DAFE hallmark, blending function with clean flair to make signals intuitive and charts stunning.
Aurora Bands:
Display: Bands around price during divergences (bullish: below low, bearish: above high), sized by ATR * bandwidth (default: 0.5).
Colors: Aqua (bullish), fuchsia (bearish), with transparency tied to divStrengthNorm.
Purpose: Highlights divergence zones with a glowing, futuristic vibe.
Divergence Orbs:
Display: Large/small circles (aqua below for bullish, fuchsia above for bearish) when bullDiv2/bearDiv2 and canSignal. Labels show strength (0–1).
Purpose: Pinpoints entries with eye-catching clarity.
Gradient Background:
Display: Green (bullish), red (bearish), or gray (neutral), 90–95% transparent.
Purpose: Sets the market mood without clutter.
Strategy Plots:
- Stop/TP Lines: Red (stops), green (TPs) for active trades.
- HTF MA: Yellow line for trend context.
- Z-Score: Blue step-line (if enabled).
- Kill Switch Warning: Red background flash when active.
What Makes This Next-Level?:
- Visuals make complex signals (divergences, filters) instantly clear, even for beginners.
- DAFE’s unique aesthetic (orbs, bands) sets it apart from generic scripts, reinforcing originality.
- Functional plots (stops, TPs) enhance trade management.
6. Metrics Dashboard
The top-right dashboard (2x8 table) is your command center, delivering real-time insights.
Metrics:
Daily Loss ($): Current loss vs. day’s start, red if > $300.
Rolling DD ($): Drawdown vs. 100-bar peak, red if > $1000.
ATR Threshold: Current percATR, green if ATR exceeds, red if not.
Z-Score: Current value, green if within threshold, red if not.
Signal: “Bullish Div” (aqua), “Bearish Div” (fuchsia), or “None” (gray).
Action: “Consider Buying”/“Consider Selling” (signal color) or “Wait” (gray).
Kill Switch Buffer ($): Smallest buffer to kill switch, green if > 0, red if 0.
Why This Is Important?:
- Consolidates critical data, making decisions effortless.
- Color-coded metrics guide beginners (e.g., green action = go).
- Buffer metric adds transparency, rare in off-the-shelf scripts.
7. Beginner Guide
Beginner Guide: Middle-right table (shown once on chart load), explains aqua orbs (bullish, buy) and fuchsia orbs (bearish, sell).
Key Features:
Futures-Optimized: Tailored for MNQ, NQ, MES, ES with point-value adjustments.
Highly Customizable: Inputs for lookback, sensitivity, filters, and risk settings.
Real-Time Insights: Dashboard and visuals update every bar.
Backtest-Ready: Fixed qty and tick calc for accurate historical testing.
User-Friendly: Guide, visuals, and dashboard make it accessible yet powerful.
Original Design: DAFE’s unique logic and visuals stand out from generic scripts.
How to Use
Add to Chart: Load on a 5min MNQ/ES chart in TradingView.
Configure Inputs: Adjust instrument, filters, or risk (defaults optimized for MNQ).
Monitor Dashboard: Watch signals, actions, and risk metrics (top-right).
Backtest: Run in strategy tester to evaluate performance.
Live Trade: Connect to a broker (e.g., Tradovate) for automation. Watch for slippage (e.g., April 27, 2025 ES issues).
Replay Test: Use bar replay (e.g., April 28, 2025 NQ drop) to test volatility handling.
Disclaimer
Trading futures involves significant risk of loss and is not suitable for all investors. Past performance is not indicative of future results. Backtest results may not reflect live trading due to slippage, fees, or market conditions. Use this strategy at your own risk, and consult a financial advisor before trading. Dskyz (DAFE) Trading Systems is not responsible for any losses incurred.
Backtesting:
Frame: 2023-09-20 - 2025-04-29
Fee Typical Range (per side, per contract)
CME Exchange $1.14 – $1.20
Clearing $0.10 – $0.30
NFA Regulatory $0.02
Firm/Broker Commis. $0.25 – $0.80 (retail prop)
TOTAL $1.60 – $2.30 per side
Round Turn: (enter+exit) = $3.20 – $4.60 per contract
Final Notes
The Dskyz (DAFE) Aurora Divergence – Quant Master isn’t just a strategy—it’s a movement. Crafted with originality and driven by community passion, it rises above the flood of generic scripts to deliver a system that’s as powerful as it is beautiful. With its quant-grade logic, DAFE visuals, and robust risk controls, it empowers traders to tackle futures with confidence and style. Join the DAFE crew, light up your charts, and let’s outsmart the markets together!
(This publishing will most likely be taken down do to some miscellaneous rule about properly displaying charting symbols, or whatever. Once I've identified what part of the publishing they want to pick on, I'll adjust and repost.)
Use it with discipline. Use it with clarity. Trade smarter.
**I will continue to release incredible strategies and indicators until I turn this into a brand or until someone offers me a contract.
Created by Dskyz, powered by DAFE Trading Systems. Trade fast, trade bold.

Dskyz (DAFE) AI Adaptive Regime - Beginners VersionDskyz (DAFE) AI Adaptive Regime - Pro: Revolutionizing Trading for All
Introduction
In the fast-paced world of financial markets, traders need tools that can keep up with ever-changing conditions while remaining accessible. The Dskyz (DAFE) AI Adaptive Regime - Pro is a groundbreaking TradingView strategy that delivers advanced, AI-driven trading capabilities to everyday traders. Available on TradingView (TradingView Scripts), this Pine Script strategy combines sophisticated market analysis with user-friendly features, making it a standout choice for both novice and experienced traders.
Core Functionality
The strategy is built to adapt to different market regimes—trending, ranging, volatile, or quiet—using a robust set of technical indicators, including:
Moving Averages (MA): Fast and slow EMAs to detect trend direction.
Average True Range (ATR): For dynamic stop-loss and volatility assessment.
Relative Strength Index (RSI) and MACD: Multi-timeframe confirmation of momentum and trend.
Average Directional Index (ADX): To identify trending markets.
Bollinger Bands: For assessing volatility and range conditions.
Candlestick Patterns: Recognizes patterns like bullish engulfing, hammer, and double bottoms, confirmed by volume spikes.
It generates buy and sell signals based on a scoring system that weighs these indicators, ensuring trades align with the current market environment. The strategy also includes dynamic risk management with ATR-based stops and trailing stops, as well as performance tracking to optimize future trades.
What Sets It Apart
The Dskyz (DAFE) AI Adaptive Regime - Pro distinguishes itself from other TradingView strategies through several unique features, which we compare to common alternatives below:
| Feature | Dskyz (DAFE) | Typical TradingView Strategies|
|---------|-------------|------------------------------------------------------------|
| Regime Detection | Automatically identifies and adapts to **four** market regimes | Often static or limited to trend/range detection |
| Multi‑Timeframe Analysis | Uses higher‑timeframe RSI/MACD for confirmation | Rarely incorporates multi‑timeframe data |
| Pattern Recognition | Detects candlestick patterns **with volume confirmation** | Limited or no pattern recognition |
| Dynamic Risk Management | ATR‑based stops and trailing stops | Often uses fixed stops or basic risk rules |
| Performance Tracking | Adjusts thresholds based on past performance | Typically static parameters |
| Beginner‑Friendly Presets | Aggressive, Conservative, Optimized profiles | Requires manual parameter tuning |
| Visual Cues | Color‑coded backgrounds for regimes | Basic or no visual aids |
The Dskyz strategy’s ability to integrate regime detection, multi-timeframe analysis, and user-friendly presets makes it uniquely versatile and accessible, addressing the needs of everyday traders who want professional-grade tools without the complexity.
-Key Features and Benefits
[Why It’s Ideal for Everyday Traders
⚡The Dskyz (DAFE) AI Adaptive Regime - Pro democratizes advanced trading by offering professional-grade tools in an accessible package. Unlike many TradingView strategies that require deep technical knowledge or fail in changing market conditions, this strategy simplifies complex analysis while maintaining robustness. Its presets and visual aids make it easy for beginners to start, while its adaptive features and performance tracking appeal to advanced traders seeking an edge.
🔄Limitations and Considerations
Market Dependency: Performance varies by market and timeframe. Backtesting is essential to ensure compatibility with your trading style.
Learning Curve: While presets simplify use, understanding regimes and indicators enhances effectiveness.
No Guaranteed Profits: Like all strategies, success depends on market conditions and proper execution. The Reddit discussion highlights skepticism about TradingView strategies’ universal success (Reddit Discussion).
Instrument Specificity: Optimized for futures (e.g., ES, NQ) due to fixed tick values. Test on other instruments like stocks or forex to verify compatibility.
📌Conclusion
The Dskyz (DAFE) AI Adaptive Regime - Pro is a revolutionary TradingView strategy that empowers everyday traders with advanced, AI-driven tools. Its ability to adapt to market regimes, confirm signals across timeframes, and manage risk dynamically. sets it apart from typical strategies. By offering beginner-friendly presets and visual cues, it makes sophisticated trading accessible without sacrificing power. Whether you’re a novice looking to trade smarter or a pro seeking a competitive edge, this strategy is your ticket to mastering the markets. Add it to your chart, backtest it, and join the elite traders leveraging AI to dominate. Trade like a boss today! 🚀
Use it with discipline. Use it with clarity. Trade smarter.
**I will continue to release incredible strategies and indicators until I turn this into a brand or until someone offers me a contract.
-Dskyz

Daily Bollinger Band StrategyOverview of the Daily Bollinger Band Strategy
1. Strategy Overview and Features
This strategy is a tool for backtesting a trading method that uses Bollinger Bands. It is *not* a tool for automated trading.
1-1. Main Display Items
The main chart displays the Bollinger Bands and the 200-day moving average.
It also shows the entry and exit points along with the position size (in units of 100 shares).
1-2. Summary of Trading Rules
For long (buy) strategies, the trade enters when the price crosses above the +1σ line of the Bollinger Bands, aiming to ride an upward trend. The position is exited when the price crosses below the middle band.
For short (sell) strategies, the trade enters when the price crosses below the -1σ line of the Bollinger Bands, aiming to ride a downward trend. The position is exited when the price crosses above the middle band.
1-3. Strategic Enhancements
The strategy uses the slope of the 200-day moving average to determine the trend direction and enter trades accordingly. This improves the win rate and payoff ratio.
Additionally, to reduce the probability of ruin, the risk per trade is limited to 1.0% of capital, and position sizing is adjusted using ATR (a volatility indicator).
2. Trading Rules
2-1. Chart Type
Only daily charts are used.
2-2. Indicators Used
(1) Bollinger Bands** (used for entry and exit signals)
- Period: Fixed at 80 days
- Upper and lower bands: Fixed at ±1σ
(2) Moving Average** (used to determine trend direction)
- Period: Fixed at 200 days
- Trend direction is judged based on whether the difference from the previous day is positive (upward) or negative (downward)
2-3. Buy Rules
Setup:
- Price crosses above the +1σ line from below
- Both the middle band and 200-day moving average are upward sloping
Entry:
- Buy at the next day’s market open using a market order
Exit:
- If the price crosses below the middle band, sell at the next day’s open using a market order
2-4. Sell Rules
Setup:
- Price crosses below the -1σ line from above
- Both the middle band and 200-day moving average are downward sloping
Entry:
- Sell at the next day’s market open using a market order
Exit:
- If the price crosses above the middle band, buy back at the next day’s open using a market order
2-5. Risk Management Rules
- Risk per trade: 1.0% of total capital (acceptable loss = capital × 1.0%)
- Position size: Acceptable loss ÷ 2ATR (rounded down to the nearest unit of 100 shares)
2-6. Other Notes
- No brokerage fees
- No pyramiding
- No partial exits
- No reverse positions (no “stop-and-reverse” trades)
3. Strategy Parameters
The following settings can be specified:
3-1. Period Settings
- Start date: Set the start date for the backtest period
- Stop date: Set the end date for the backtest period
3-2. Display of Trend and Signals
- Show trend: When checked, the background color of the bars is light red for an uptrend and light blue for a downtrend
- Show signal: When checked, entry and exit signals are displayed (note: signals are executed at the next day’s open, so there is a one-day lag in the display)
3-3. Capital Management Settings
- Funds: Capital available for trading (in JPY)
- Risk rate: Specify what percentage of the capital to risk per trade
Settings in the “Properties” tab are not used in this strategy.
4. Backtest Results (Example)
Here are the backtest results conducted by the author:
- Target Stocks: All components of the Nikkei 225
- Test Period: January 4, 2000 – December 30, 2024
- Data Points: 12,886
- Win Rate: 33.45%
- Net Profit: ¥82,132,380
- Payoff Ratio: 2.450
- Expected Value: ¥6,373.8
- Risk Rate: 1.0%
- Probability of Ruin: 0.00%
---
デイリー・ボリンジャーバンド・ストラテジーの概要
1. ストラテジーの概要と特徴
このストラテジーは、ボリンジャーバンドを使ったトレード手法のバックテストを行うツールです。自動売買を行うツールではありません。
1-1. 主な表示項目
メインチャートにボリンジャーバンドと 200日移動平均線を表示します。
また、エントリーと手仕舞いのタイミングと数量(100株単位)も表示されます。
1-2. トレードルールの概要
買い戦略の場合、ボリンジャーバンドの +1σ 超えでエントリーして上昇トレンドに乗り、ミドルバンドを割ったら決済します。
売り戦略の場合、ボリンジャーバンドの -1σ 割りでエントリーして下降トレンドに乗り、ミドルバンドを上抜けたら決済します。
1-3. ストラテジーの工夫点
200日移動平均線の傾きを見てトレンド方向にエントリーをしています。こうして勝率とペイオフレシオの成績を向上しています。
また、破産確率を抑えるために、リスク資金比率を 1.0% にして、ATR(ボラティリティ指標) を使って注文数を調整しています。
2. 売買ルール
2-1. 使用するチャート
日足チャートに限定します
2-2. 使用する指標
(1) ボリンジャーバンド(仕掛けと手仕舞いのシグナルに使用)
期間は80日に固定
上下バンドは ±1σ に固定
(2) 移動平均線(トレンドの方向を見るために使用)
期間は200日に固定
移動平均の値の前日との差がプラスのとき上向き、マイナスのとき下向きと判断
2-3. 買いのルール
セットアップ:ボリンジャーバンドの +1σ を価格が下から上に交差 かつ ミドルバンドと 200日移動平均線が上向き
仕掛け:翌日の寄り付きに成行で買う
手仕舞い:ボリンジャーバンドのミドルバンドを価格が上から下に交差したら、翌日の寄り付きに成行で売る
2-4. 売りのルール
セットアップ:ボリンジャーバンドの -1σ を価格が上から下に交差 かつ ミドルバンドと 200日移動平均線が下向き
仕掛け:翌日の寄り付きに成行で売る
手仕舞い:ボリンジャーバンドのミドルバンドを価格が下から上に交差したら、翌日の寄り付きに成行で買い戻す
2-5. 資金管理のルール
リスク資金比率:資産の 1.0%(許容損失 = 資産 × 1.0%)
注文数:許容損失 ÷ 2ATR(単元株数未満は切り捨て)
2-6. その他
仲介手数料:なし
ピラミッディング:なし
分割決済:なし
ドテン:しない
3. ストラテジーのパラメーター
次の項目が指定できます。
3-1. 期間の設定
Staer date : バックテストの検証期間の開始日を指定します
Stop date : バックテストの検証期間の終了日を指定します
3-2. トレンドとシグナルの表示
Show trend : チェックを入れると、バーの背景色が、トレンドが上昇のときは薄い赤で、下落のときは薄い青で表示されます
Show signal : チェックを入れると、エントリーと手仕舞いのシグナルを表示します(シグナルの出た翌日の寄り付きに売買をするので表示に1日のずれがあります)
3-3. 資金管理用の設定
Funds : トレード用の資金(円)
Risk rate : 許容損失を資金の何%にするかで指定します
「プロパティタブ」で設定する値は、このストラテジーでは有効ではありません。
4. バックテストの結果(例)
作者がバックテストを実施した結果をお知らせします。
対象銘柄:日経225構成銘柄すべて
対象期間:2000年1月4日~2024年12月30日
データ件数:12,886
勝率:33.45%
純利益:82,132,380
ペイオフレシオ:2.450
期待値:6,373.8
リスク資金比率:1.0%
破産確率:0.00%

QuantJazz Turbine Trader BETA v1.17QuantJazz Turbine Trader BETA v1.17 - Strategy Introduction and User Guide
Strategy Introduction
Welcome to the QuantJazz Turbine Trader BETA v1.17, a comprehensive trading strategy designed for TradingView. This strategy is built upon oscillator principles, drawing inspiration from the Turbo Oscillator by RedRox, and incorporates multiple technical analysis concepts including RSI, MFI, Stochastic oscillators, divergence detection, and an optional FRAMA (Fractal Adaptive Moving Average) filter.
The Turbine Trader aims to provide traders with a flexible toolkit for identifying potential entry and exit points in the market. It presents information through a main signal line oscillator, a histogram, and various visual cues like dots, triangles, and divergence lines directly on the indicator panel. The strategy component allows users to define specific conditions based on these visual signals to trigger automated long or short trades within the TradingView environment.
This guide provides an overview of the strategy's components, settings, and usage. Please remember that this is a BETA version (v1.17). While developed with care, it may contain bugs or behave unexpectedly.
LEGAL DISCLAIMER: QuantJazz makes no claims about the fitness or profitability of this tool. Trading involves significant risk, and you may lose all of your invested capital. All trading decisions made using this strategy are solely at the user's discretion and responsibility. Past performance is not indicative of future results. Always conduct thorough backtesting and risk assessment before deploying any trading strategy with real capital.
This work is licensed under Creative Commons Attribution-NonCommercial-ShareAlike 4.0 International.
Core Concepts and Visual Elements
The Turbine Trader indicator displays several components in its own panel below the main price chart:
1. Signal Line (Avg & Avg2): This is the primary oscillator. It's a composite indicator derived from RSI, MFI (Money Flow Index), and Stochastic calculations, smoothed using an EMA (Exponential Moving Average).
Avg: The faster smoothed signal line.
Avg2: The slower smoothed signal line.
Color Coding: The space between Avg and Avg2 is filled. The color (Neon Blue/gColor or Neon Purple/rColor) indicates the trend based on the relationship between Avg and Avg2. Blue suggests bullish momentum (Avg > Avg2), while Purple suggests bearish momentum (Avg2 > Avg).
Zero Line Crosses: Crossovers of the Avg line with the zero level can indicate shifts in momentum.
2. Histogram (resMfi): This histogram is based on smoothed and transformed MFI calculations (Fast MFI and Slow MFI).
Color Coding: Bars are colored Neon Blue (histColorUp) when above zero, suggesting bullish pressure, and Neon Purple (histColorDn) when below zero, suggesting bearish pressure. Transparency is applied.
Zero Line Crosses: Crossovers of the histogram with the zero level can signal potential shifts in money flow.
3. Reversal Points (Dots): Dots appear on the Signal Line (specifically on Avg2) when the color changes (i.e., Avg crosses Avg2).
Small Dots: Appear when a reversal occurs while the oscillator is in an "extreme" zone (below -60 for bullish reversals, above +60 for bearish reversals).
Large Dots: Appear when a reversal occurs outside of these extreme zones.
Colors: Blue (gRdColor) for bullish reversals (Avg crossing above Avg2), Purple (rRdColor) for bearish reversals (Avg crossing below Avg2).
4. Take Profit (TP) Signals (Triangles): Small triangles appear above (+120) or below (-120) the zero line.
Bearish Triangle (Down, Purple rTpColor): Suggests a potential exit point for long positions or an entry point for short positions, based on the oscillator losing upward momentum above the 50 level.
Bullish Triangle (Up, Blue gTpColor): Suggests a potential exit point for short positions or an entry point for long positions, based on the oscillator losing downward momentum below the -50 level.
5. Divergence Lines: The strategy automatically detects and draws potential regular and hidden divergences between the price action (highs/lows) and the Signal Line (Avg).
Regular Bullish Divergence (White bullDivColor line, ⊚︎ label): Price makes a lower low, but the oscillator makes a higher low. Suggests potential bottoming.
Regular Bearish Divergence (White bearDivColor line, ⊚︎ label): Price makes a higher high, but the oscillator makes a lower high. Suggests potential topping.
Hidden Bullish Divergence (bullHidDivColor line, ⊚︎ label): Price makes a higher low, but the oscillator makes a lower low. Suggests potential continuation of an uptrend.
Hidden Bearish Divergence (bearHidDivColor line, ⊚︎ label): Price makes a lower high, but the oscillator makes a higher high. Suggests potential continuation of a downtrend.
Delete Broken Divergence Lines: If enabled, newer divergence lines originating from a similar point will replace older ones.
6. Status Line: A visual bar at the top (95 to 105) and bottom (-95 to -105) of the indicator panel. Its color intensity reflects the confluence of signals:
Score Calculation: +1 if Avg > Avg2, +1 if Avg > 0, +1 if Histogram > 0.
Top Bar (Bullish): Bright Blue (gStatColor) if score is 3, Faded Blue if score is 2, Black otherwise.
Bottom Bar (Bearish): Bright Purple (rStatColor) if score is 0, Faded Purple if score is 1, Black otherwise.
Strategy Settings Explained
The strategy's behavior is controlled via the settings panel (gear icon).
1. Date Range:
Start Date, End Date: Define the period for backtesting. Trades will only occur within this range.
2. Optional Webhook Configuration: (For Automation)
3C Email Token, 3C Bot ID: Enter your 3Commas API credentials if you plan to automate trading using webhooks. The strategy generates JSON alert messages compatible with 3Commas. You can go ahead and just leave the text field as defaulted, "TOKEN HERE" / "BOT ID HERE" if not using any bot automations at this time. You can always come back later and automate it. More info can be made available from QuantJazz should you need automation assistance with custom indicators and trading strategies.
3. 🚀 Signal Line:
Turn On/Off: Show or hide the main signal lines (Avg, Avg2).
gColor, rColor: Set the colors for bullish and bearish signal line states.
Length (RSI): The lookback period for the internal RSI calculation. Default is 2.
Smooth (EMA): The smoothing period for the EMAs applied to the composite signal. Default is 9.
RSI Source: The price source used for RSI calculation (default: close).
4. 📊 Histogram:
Turn On/Off: Show or hide the histogram.
histColorUp, histColorDn: Set the colors for positive and negative histogram bars.
Length (MFI): The base lookback period for MFI calculations. Default is 5. Fast and Slow MFI lengths are derived from this.
Smooth: Smoothing period for the final histogram output. Default is 1 (minimal smoothing).
5.💡 Other:
Show Divergence Line: Toggle visibility of regular divergence lines.
bullDivColor, bearDivColor: Colors for regular divergence lines.
Show Hidden Divergence: Toggle visibility of hidden divergence lines.
bullHidDivColor, bearHidDivColor: Colors for hidden divergence lines.
Show Status Line: Toggle visibility of the top/bottom status bars.
gStatColor, rStatColor: Colors for the status line bars.
Show TP Signal: Toggle visibility of the TP triangles.
gTpColor, rTpColor: Colors for the TP triangles.
Show Reversal points: Toggle visibility of the small/large dots on the signal line.
gRdColor, rRdColor: Colors for the reversal dots.
Delete Broken Divergence Lines: Enable/disable automatic cleanup of older divergence lines.
6. ⚙️ Strategy Inputs: (CRITICAL for Trade Logic)
This section defines which visual signals trigger trades. Each signal (Small/Large Dots, TP Triangles, Bright Bars, Signal/Histogram Crosses, Signal/Histogram Max/Min, Divergences) has a dropdown menu:
Long: This signal can trigger a long entry.
Short: This signal can trigger a short entry.
Disabled: This signal will not trigger any entry.
Must Be True Checkbox: If checked for a specific signal, that signal's condition must be met for any trade (long or short, depending on the dropdown selection for that signal) to be considered. Multiple "Must Be True" conditions act as AND logic – all must be true simultaneously.
How it Works:
The strategy first checks if all conditions marked as "Must Be True" (for the relevant trade direction - long or short) are met.
If all "Must Be True" conditions are met, it then checks if at least one of the conditions not marked as "Must Be True" (and set to "Long" or "Short" respectively) is also met.
If both steps pass, and other filters (like Date Range, FRAMA) allow, an entry order is placed.
Example: If "Large Bullish Dot" is set to "Long" and "Must Be True" is checked, AND "Bullish Divergence" is set to "Long" but "Must Be True" is not checked: A long entry requires BOTH the Large Bullish Dot AND the Bullish Divergence to occur simultaneously. If "Large Bullish Dot" was "Long" but not "Must Be True", then EITHER a Large Bullish Dot OR a Bullish Divergence could trigger a long entry (assuming no other "Must Be True" conditions are active).
Note: By default, the strategy is configured for long-only trades (strategy.risk.allow_entry_in(strategy.direction.long)). To enable short trades, you would need to comment out or remove this line in the Pine Script code and configure the "Strategy Inputs" accordingly.
7. 💰 Take Profit Settings:
Take Profit 1/2/3 (%): The percentage above the entry price (for longs) or below (for shorts) where each TP level is set. (e.g., 1.0 means 1% profit).
TP1/2/3 Percentage: The percentage of the currently open position to close when the corresponding TP level is hit. The percentages should ideally sum to 100% if you intend to close the entire position across the TPs.
Trailing Stop (%): The percentage below the highest high (for longs) or above the lowest low (for shorts) reached after the activation threshold, where the stop loss will trail.
Trailing Stop Activation (%): The minimum profit percentage the trade must reach before the trailing stop becomes active.
Re-entry Delay (Bars): The minimum number of bars to wait after a TP is hit before considering a re-entry. Default is 1 (allows immediate re-entry on the next bar if conditions met).
Re-entry Price Offset (%): The percentage the price must move beyond the previous TP level before a re-entry is allowed. This prevents immediate re-entry if the price hovers around the TP level.
8. 📈 FRAMA Filter: (Optional Trend Filter)
Use FRAMA Filter: Enable or disable the filter.
FRAMA Source, FRAMA Period, FRAMA Fast MA, FRAMA Slow MA: Parameters for the FRAMA calculation. Defaults provided are common starting points.
FRAMA Filter Type:
FRAMA > previous bars: Allows trades only if FRAMA is significantly above its recent average (defined by FRAMA Percentage and FRAMA Lookback). Typically used to confirm strong upward trends for longs.
FRAMA < price: Allows trades only if FRAMA is below the current price (framaSource). Can act as a baseline trend filter.
FRAMA Percentage (X), FRAMA Lookback (Y): Used only for the FRAMA > previous bars filter type.
How it Affects Trades: If Use FRAMA Filter is enabled:
Long entries require the FRAMA filter condition to be true.
Short entries require the FRAMA filter condition to be false (as currently coded, this acts as an inverse filter for shorts if enabled).
How to Use the Strategy
1. Apply to Chart: Open your desired chart on TradingView. Click "Indicators", find "QuantJazz Turbine Trader BETA v1.17" (you might need to add it via Invite-only scripts or if published publicly), and add it to your chart. The oscillator appears below the price chart, and the strategy tester panel opens at the bottom.
2. Configure Strategy Properties: In the Pine Script code itself (or potentially via the UI if supported), adjust the strategy() function parameters like initial_capital, default_qty_value, commission_value, slippage, etc., to match your account, broker fees, and risk settings. The user preferences provided (e.g., 1000 initial capital, 0.1% commission) are examples. Remember use_bar_magnifier is false by default in v1.17.
3. Configure Inputs (Settings Panel):
Set the Date Range for backtesting.
Crucially, configure the ⚙️ Strategy Inputs. Decide which signals should trigger entries and whether they are mandatory ("Must Be True"). Start simply, perhaps enabling only one or two signals initially, and test thoroughly. Remember the default long-only setting unless you modify the code.
Set up your 💰 Take Profit Settings, including TP levels, position size percentages for each TP, and the trailing stop parameters. Decide if you want to use the re-entry feature.
Decide whether to use the 📈 FRAMA Filter and configure its parameters if enabled.
Adjust visual elements (🚀 Signal Line, 📊 Histogram, 💡 Other) as needed for clarity.
4. Backtest: Use the Strategy Tester panel in TradingView. Analyze the performance metrics (Net Profit, Max Drawdown, Profit Factor, Win Rate, Trade List) across different assets, timeframes, and setting configurations. Pay close attention to how different "Strategy Inputs" combinations perform.
5. Refine: Based on backtesting results, adjust the input settings, TP/SL strategy, and signal combinations to optimize performance for your chosen market and timeframe, while being mindful of overfitting.
6. Automation (Optional): If using 3Commas or a similar platform:
Enter your 3C Email Token and 3C Bot ID in the settings.
Create alerts in TradingView (right-click on the chart or use the Alert panel).
Set the Condition to "QuantJazz Turbine Trader BETA v1.17".
In the "Message" box, paste the corresponding placeholder, which will pass the message in JSON from our custom code to TradingView to pass through your webhook: {{strategy.order.alert_message}}.
In the next tab, configure the Webhook URL provided by your automation platform. Put a Whale sound, while you're at it! 🐳
When an alert triggers, TradingView will send the pre-formatted JSON message from the strategy code to your webhook URL.
Final Notes
The QuantJazz Turbine Trader BETA v1.17 offers a wide range of customizable signals and strategy logic. Its effectiveness heavily depends on proper configuration and thorough backtesting specific to the traded asset and timeframe. Start with the default settings, understand each component, and methodically test different combinations of signals and parameters. Remember the inherent risks of trading and never invest capital you cannot afford to lose.

Multi-Timeframe Parabolic SAR Strategy ver 1.0Multi-Timeframe Parabolic SAR Strategy (MTF PSAR) - Enhanced Trend Trading
This strategy leverages the power of the Parabolic SAR (Stop and Reverse) indicator across multiple timeframes to provide robust trend identification, precise entry/exit signals, and dynamic trailing stop management. By combining the insights of both the current chart's timeframe and a user-defined higher timeframe, this strategy aims to improve trading accuracy, reduce risk, and capture more significant market moves.
Key Features:
Dual Timeframe Analysis: Simultaneously analyzes the Parabolic SAR on the current chart and a higher timeframe (e.g., Daily PSAR on a 1-hour chart). This allows you to align your trades with the dominant trend and filter out noise from lower timeframes.
Configurable PSAR: Fine-tune the PSAR calculation with adjustable Start, Increment, and Maximum values to optimize sensitivity for your trading style and the asset's volatility.
Independent Timeframe Control: Choose to display and trade based on either or both the current timeframe PSAR and the higher timeframe PSAR. Focus on the most relevant information for your analysis.
Clear Visual Signals: Distinct colors for the current and higher timeframe PSAR dots provide a clear visual representation of potential entry and exit points.
Multiple Entry Strategies: The strategy offers flexible entry conditions, allowing you to trade based on:
Confirmation: Both current and higher timeframe PSAR signals agree and the current timeframe PSAR has just flipped direction. (Most conservative)
Current Timeframe Only: Trades based solely on the current timeframe PSAR, ideal for when the higher timeframe is less relevant or disabled.
Higher Timeframe Only: Trades based solely on the higher timeframe PSAR.
Dynamic Trailing Stop (PSAR-Based): Implements a trailing stop-loss based on the current timeframe's Parabolic SAR. This helps protect profits by automatically adjusting the stop-loss as the price moves in your favor. Exits are triggered when either the current or HTF PSAR flips.
No Repainting: Uses lookahead=barmerge.lookahead_off in the security() function to ensure that the higher timeframe data is accessed without any data leakage, preventing repainting issues.
Fully Configurable: All parameters (PSAR settings, higher timeframe, visibility, colors) are adjustable through the strategy's settings panel, allowing for extensive customization and optimization.
Suitable for Various Trading Styles: Applicable to swing trading, day trading, and trend-following strategies across various markets (stocks, forex, cryptocurrencies, etc.).
How it Works:
PSAR Calculation: The strategy calculates the standard Parabolic SAR for both the current chart's timeframe and the selected higher timeframe.
Trend Identification: The direction of the PSAR (dots below price = uptrend, dots above price = downtrend) determines the current trend for each timeframe.
Entry Signals: The strategy generates buy/sell signals based on the chosen entry strategy (Confirmation, Current Timeframe Only, or Higher Timeframe Only). The Confirmation strategy offers the highest probability signals by requiring agreement between both timeframes.
Trailing Stop Exit: Once a position is entered, the strategy uses the current timeframe PSAR as a dynamic trailing stop. The stop-loss is automatically adjusted as the PSAR dots move, helping to lock in profits and limit losses. The strategy exits when either the Current or HTF PSAR changes direction.
Backtesting and Optimization: The strategy automatically backtests on the chart's historical data, allowing you to evaluate its performance and optimize the settings for different assets and timeframes.
Example Use Cases:
Trend Confirmation: A trader on a 1-hour chart observes a bullish PSAR flip on the current timeframe. They check the MTF PSAR strategy and see that the Daily PSAR is also bullish, confirming the strength of the uptrend and providing a high-probability long entry signal.
Filtering Noise: A trader on a 5-minute chart wants to avoid whipsaws caused by short-term price fluctuations. They use the strategy with a 1-hour higher timeframe to filter out noise and only trade in the direction of the dominant trend.
Dynamic Risk Management: A trader enters a long position and uses the current timeframe PSAR as a trailing stop. As the price rises, the PSAR dots move upwards, automatically raising the stop-loss and protecting profits. The trade is exited when the current (or HTF) PSAR flips to bearish.
Disclaimer:
The Parabolic SAR is a lagging indicator and can produce false signals, particularly in ranging or choppy markets. This strategy is intended for educational and informational purposes only and should not be considered financial advice. It is essential to backtest and optimize the strategy thoroughly, use it in conjunction with other technical analysis tools, and implement sound risk management practices before using it with real capital. Past performance is not indicative of future results. Always conduct your own due diligence and consider your risk tolerance before making any trading decisions.
